Artur Zas / Profilo
I'm an active Forex trader since 2001 and a freelance software developer specializing in C/C++, C#, and MQL.
You can contact me at https://azinvest.freshdesk.com/
Some of my work includes:
Visual Trading Console and Trade Manager for MT4: https://www.az-invest.eu/visual-trading-console-multi-terminal-trade-manager-for-metatrader
Renko & Tick charting for MT4 with full TickDataSuite & TickStory compatibility for tick-by-tick backtesting: https://www.az-invest.eu/renko-tick-chart-plug-in-for-metatrader4
RangeBars for MT4 with full TickDataSuite & TickStory compatibility for tick-by-tick backtesting: https://www.az-invest.eu/rangebars-plug-in-for-metatrader4
Median Renko charting with Hybrid/Turbo/Mean and better renko capabilities: https://www.az-invest.eu/median-renko-plug-in-for-metatrader-4
The package also offers full support for tick data backtesting with 99% modeling quality via MT4's backtester loaded via TickDataSuite or TickStory: https://www.az-invest.eu/backtesting-eas-on-rangebars-renko-median-renko-pointo-charts-using-tick-data-on-mt4
Point Original bars (PointO), also with optional tick data backtesting: https://www.az-invest.eu/median-renko-plug-in-for-metatrader-4
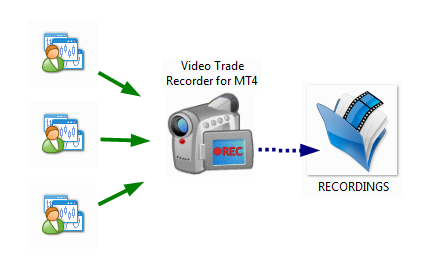
Multi-channel Video Trade Log software for MT4 & MT5: https://www.az-invest.eu/video-trade-recorder-for-metatrader4
Amici
450
Richieste
In uscita
Artur Zas

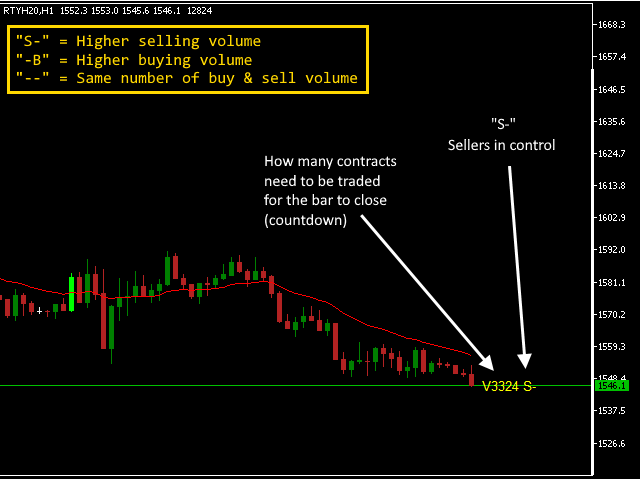
Volume Bar Chart now available for exchange-traded instruments (futures, stocks, indices, etc.).
https://www.mql5.com/en/market/product/46726
https://www.mql5.com/en/market/product/46726

Artur Zas


I just uploaded an update for the MT4 version of UltimateRenko. The latest version is now a full implementation of the Ultimate Renko algorithm and gives you full control of the way the charts look.
https://www.mql5.com/en/market/product/24686
https://www.mql5.com/en/market/product/24686

tradeblazer
2019.09.26
Artur Zas I'm trying to reach you over on your main website, I'm very interested in your Visual Trading Console system. I sent you several messages through your contact system but never got a reply. Please reach out to me at Deezenutzyo2004@hotmail.com. I have questions about your software before I purchase it. Thank you in advance.
Artur Zas
2020.12.15
I'm not able to locate your messages. Did you go through my helpdesk? https://azinvest.freshdesk.com
Artur Zas


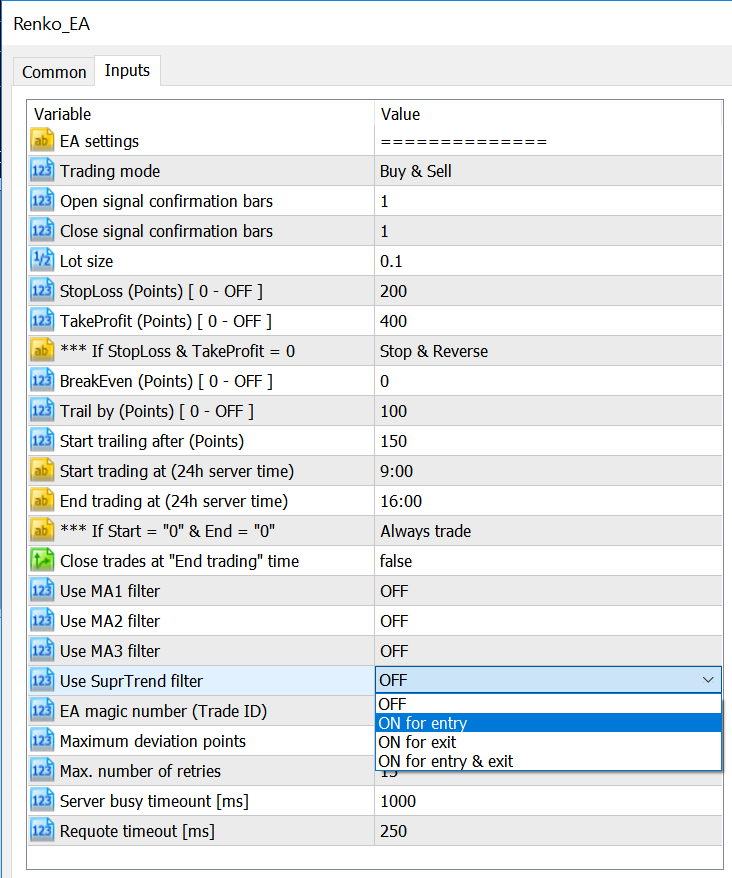
Open source Renko EA added to my GitHub repo:
https://github.com/9nix6/Median-and-Turbo-Renko-indicator-bundle
https://github.com/9nix6/Median-and-Turbo-Renko-indicator-bundle

samiabid
2021.04.17
Hello Sir i am messaging you in mql5 ib please reply me Sir.. I need your help to configure your ultimate EA on your ultimate renko indicator please.. Come to ib please..
Artur Zas


The Ultimate Renko indicator (version 2.0) for MT5 is in the final beta phase. The list of additional indicators that have been converted to work directly with renko is as follows:
ADX
Aroon Oscillator
ATR
CCI
Color HMA
DT Oscillator
Fractals
GANN Hi Lo Activator SSL
GMMA
Heiken Ashi
Heiken Ashi Smoothed
Ichimoku
MACD
Momentum
NRTR
ROC
RSI
Stochastic
VEMA Wilders DMI
Volumes
ZigZag
Please let me know if there are any other indicators that you would like to have working with the renko charts so I can have them ready for you once version 2.0 goes live.
https://www.mql5.com/en/market/product/16347

KristyDarling
2018.03.22
Many thanks for your indicators , I use MT4 median/turbo renko from many sources buy coudn't find anythings so great like this MT5 .
Artur Zas

Check out the Video Trade Recorder for Metatrader 4 & Metatrader 5
An ideal tool to make sure that the indicators you are using do not repaint during the day.
Check it out at: https://www.az-invest.eu/video-trade-recorder-for-metatrader4
An ideal tool to make sure that the indicators you are using do not repaint during the day.
Check it out at: https://www.az-invest.eu/video-trade-recorder-for-metatrader4

Artur Zas

Registrato sulla MQL5.community
Peter Wressnigg
2016.02.14
hello Artur, I am interested to buy this indicator. I clicked on "buy", but nothing happens. Could you please help me?
Thank you very much
Peter
Thank you very much
Peter
: