Squeeze Momentum Indicator by Giles
- Indicatori
- Jing Bo Wu
- Versione: 1.0
This is a derivative of John Carter's "TTM Squeeze" volatility indicator, as discussed in his book "Mastering the Trade" (chapter 11).
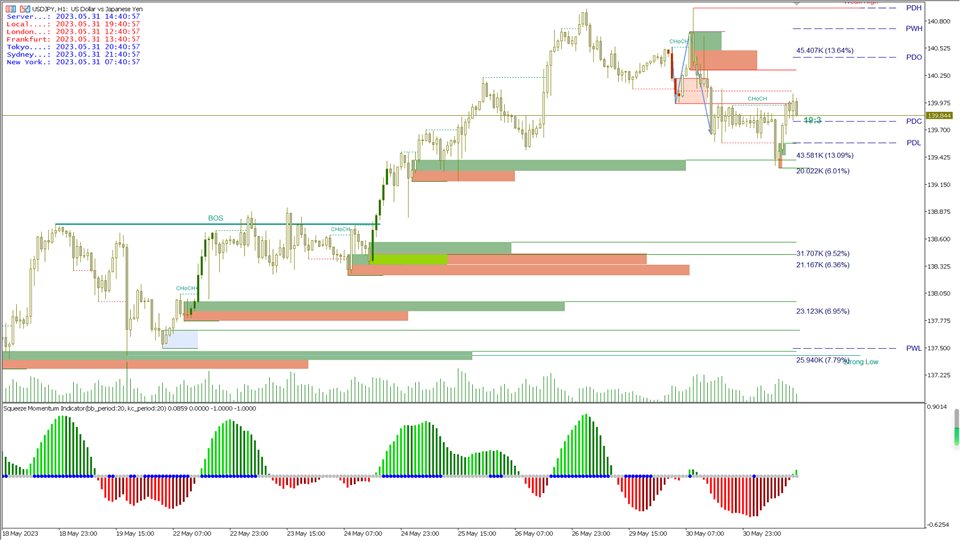
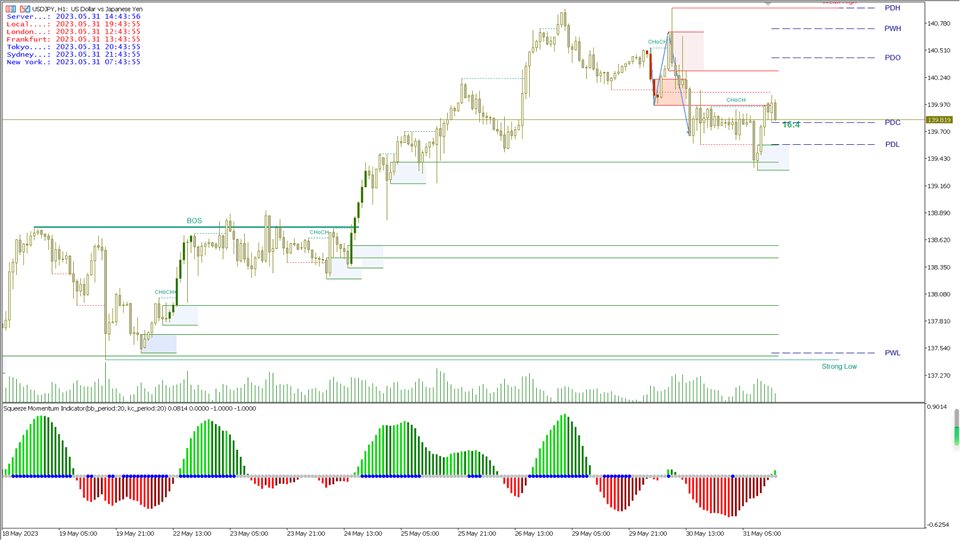
Gray dot on the midline show that the market just entered a squeeze (Bollinger Bands are with in Keltner Channel). This signifies low volatility, market preparing itself for an explosive move (up or down). Blue dot signify "Squeeze release".
Mr.Carter suggests waiting till the first blue after a gray dot, and taking a position in the direction of the momentum (for ex., if momentum value is above zero, go long). Exit the position when the momentum changes (increase or decrease --- signified by a color change). My (limited) experience with this shows, an additional indicator like ADX / WaveTrend, is needed to not miss good entry points. Also, Mr.Carter uses simple momentum indicator, while I have used a different method (linreg based) to plot the histogram.
More info:
- Book: Mastering The Trade by John F Carter
The indicator works best when two or more timeframes are in a squeeze. For example, both 15min and 5min periods are in a squeeze period. Enter a trade in the direction of the movement when 5min period is released from squeeze.
For more information how to use this indicator best, just search the internet for TTM Squeeze or Squeeze Momentum and you will find a ton of articles.


For anyone who consider Capital management the first important element in their trading and play with numbers, this indicator is an absolute help. For instance I always perform swing or day trade which has at minimum 4 hours rest between each new decision. according to my trading style, this indicator is very helpful. Thanks for the creator's nobility and innovation.