Fib Auto Trendline
- Indicatori
- Nhlanhla Brilliant Mashavha
- Versione: 1.1
- Attivazioni: 5
INTRODUCTION
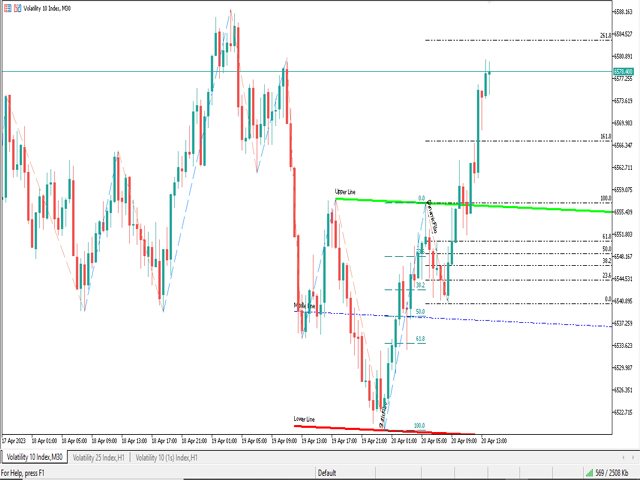
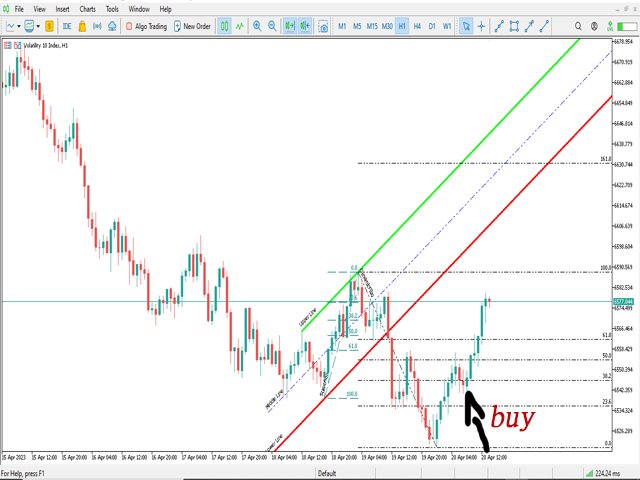
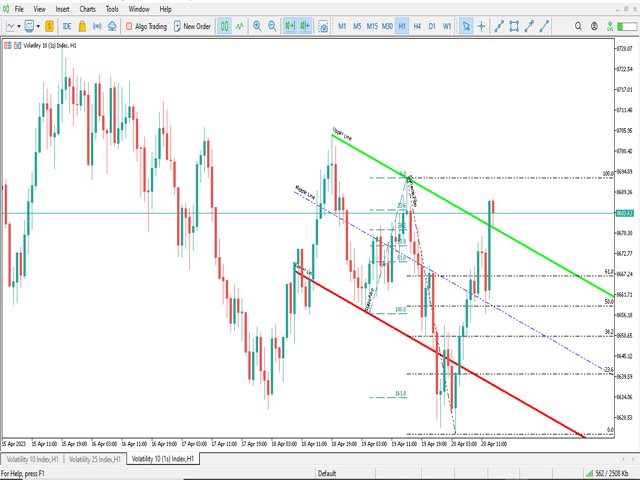
The Fib Autotrendline is a basic tool that analysts use to find out when a security's trend is reversing. By determining the support and resistance areas, it helps to identify significant changes in price while filtering out short-term fluctuations, thus eliminating the noise of everyday market conditions. It is an excellent tool for any trader who follows indicators that use swing highs and swing lows.
How to Use the fib Auto Trendline Indicator
The Fib Auto Trendline indicator is an effective tool for analyzing historical data. It is only based on hindsight and is not predictive in any way. It is based on the past prices of securities and cannot forecast the next swing highs and swing lows.
Even though the zig zag indicator is not predictive, it is still very useful. It is often used in conjunction with applications such as Elliott wave counts. Analysts can also use the historical highs and lows to draw lines to identify Fibonacci projections and retracements. Chart patterns such as double bottoms, double tops, and head and shoulders can also be determined.


