ZT Signal 2 AM
- Indicatori
- Andriy Matviyevs'kyy
- Versione: 26.0
- Aggiornato: 12 settembre 2023
- Attivazioni: 5
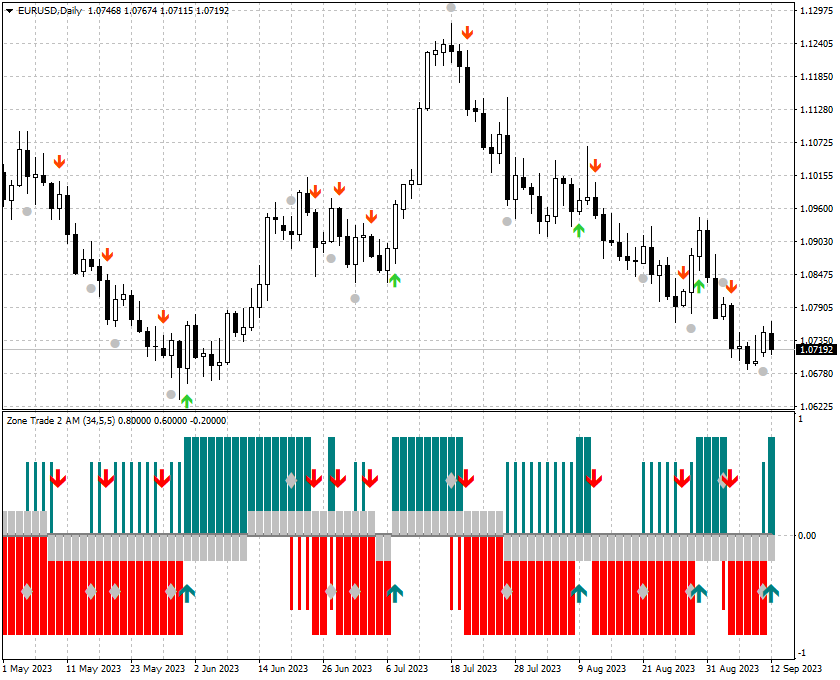
The indicator displays elements of the trading system, name trading in the zone, described by Bill Williams.
Sell signals are formed when MACD and OsMA values are falling simultaneously (Bill Williams calls these indicators АО and АС in his book), while buy signals appear when both indicators are rising.
The indicator signals are confirmed when the price exceeds the High/Low of the bar where the indicator generated the signal.
The indicator is intended for trend trading.
Countertrend signals are only used to close positions.