Versus USD MT5
- Indicatori
- Vonjinirina Alfred Randrianiaina
- Versione: 1.10
- Aggiornato: 5 maggio 2023
- Attivazioni: 10
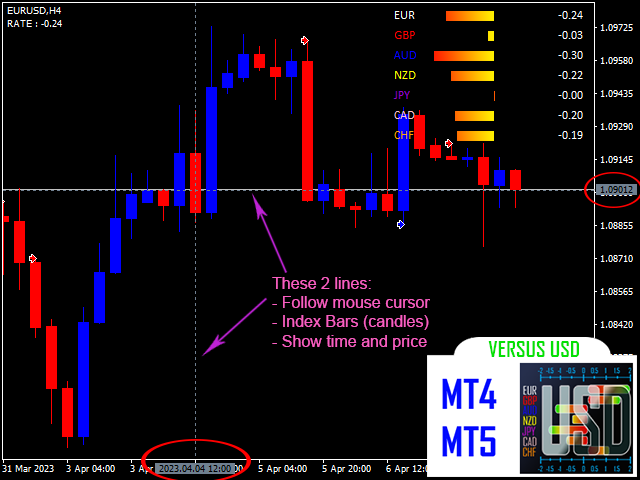
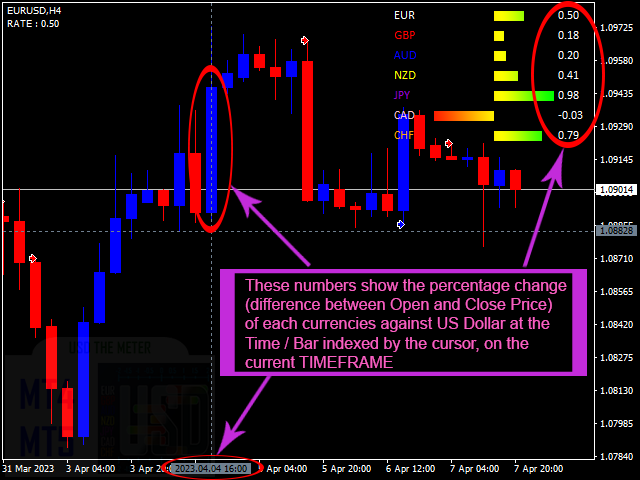
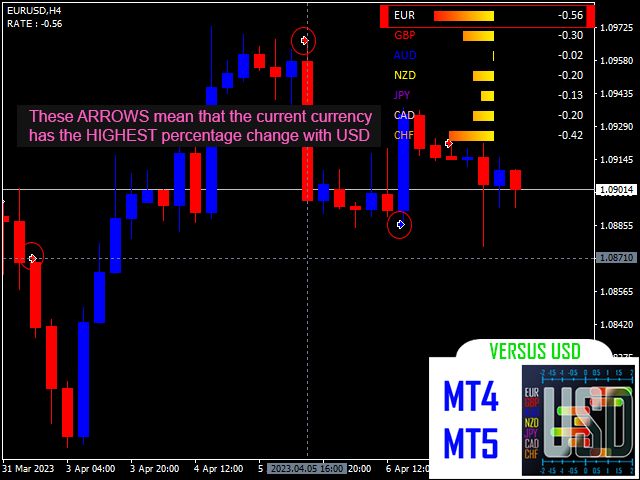
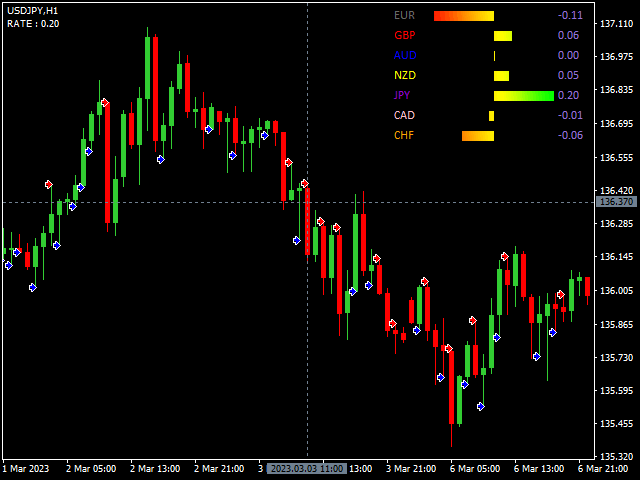
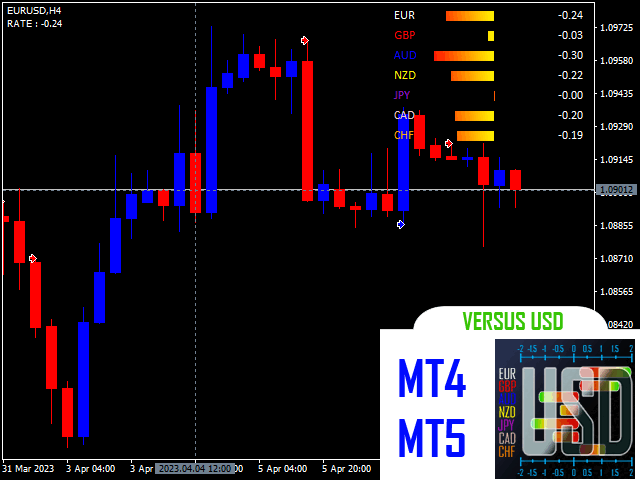
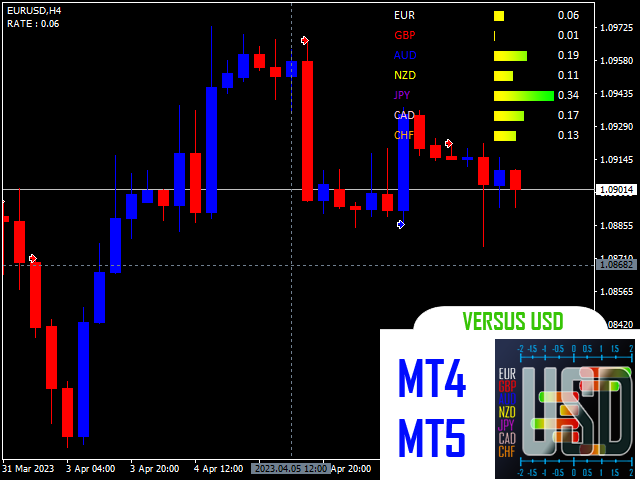
Versus USD calcola la variazione di prezzo di ciascuna valuta principale rispetto al dollaro americano e mostra una visione chiara e comparativa delle loro prestazioni per ciascun periodo o barra indicizzati dal cursore nel Timeframe attuale del grafico con barre di avanzamento. Inoltre, segna una freccia sulla barra/periodo in cui la valuta in questione ha avuto il tasso di cambio più alto o più basso rispetto al dollaro americano rispetto alle altre valute, fornendo così una misura più precisa delle prestazioni della valuta.
Il dollaro americano è la valuta primaria utilizzata per misurare le prestazioni di ogni valuta principale nel mercato dei cambi in quanto è la valuta più liquida e ampiamente utilizzata nelle transazioni internazionali. Inoltre, la maggior parte delle transazioni forex coinvolge il dollaro americano come valuta di base o di riferimento, rendendo più facile confrontare ed valutare le prestazioni delle altre valute.
Indipendentemente dal tuo livello di esperienza nel trading forex e dal tuo stile di trading, che tu abbia già una strategia redditizia o meno, questo indicatore può migliorare le tue abilità in poco tempo. Inoltre, è facile da usare grazie alle seguenti caratteristiche:
- Compatibile con tutte le 28 principali coppie di valute
- Funziona con tutti i Timeframe (M1 - MN)
- Non richiede alcuna configurazione, tutto è automatizzato
- Disponibile su MT4 e MT5
PREREQUISITI:
1. Per utilizzare correttamente l'indicatore, i dati storici delle sette principali coppie di valute devono essere sincronizzati e aggiornati, ed è consigliabile aprire i grafici di queste coppie, anche se non si sta utilizzando l'indicatore con una di esse.
Queste 7 coppie di valute principali sono:
- EURUSD
- GBPUSD
- AUDUSD
- NZDUSD
- USDJPY
- USDCAD
- USDCHF
2. È fondamentale che i dati storici degli altri simboli utilizzati con l'indicatore siano aggiornati e sincronizzati anche con quelli delle sette principali coppie di valute.
RACCOMANDAZIONI:
- Raccomando vivamente agli utenti di utilizzare l'indicatore con le coppie di valute che contengono JPY poiché è molto più affidabile e preciso con queste coppie.
- Attendere finché i dati storici delle 7 principali coppie di valute (contenenti USD), così come quella con cui si utilizzerà l'indicatore, sono aggiornati e sincronizzati prima di aggiungere Versus USD al proprio grafico per evitare potenziali bug.
- Se l'indicatore incontra un bug, suggerisco di passare a un altro timeframe e quindi tornare al timeframe desiderato.
Join the Versus USD chat if you have questions or reports or something else about the indicator.
Versus USD MT4 : https://www.mql5.com/fr/market/product/97127