Horizontal tick volumes mt5
- Indicatori
- Aleksandr Suchkov
- Versione: 4.1
- Aggiornato: 22 maggio 2023
- Attivazioni: 7
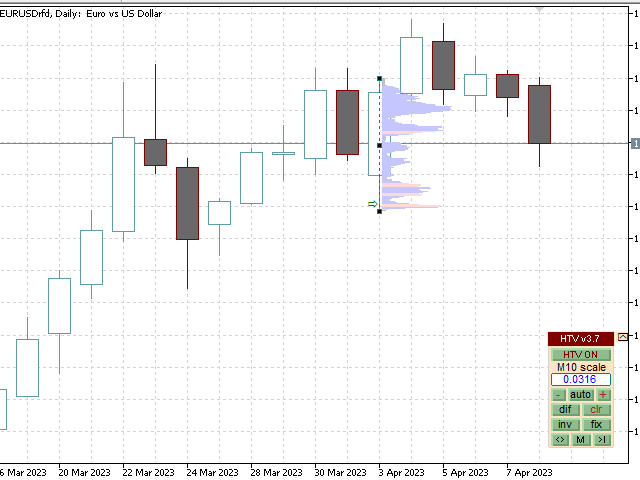
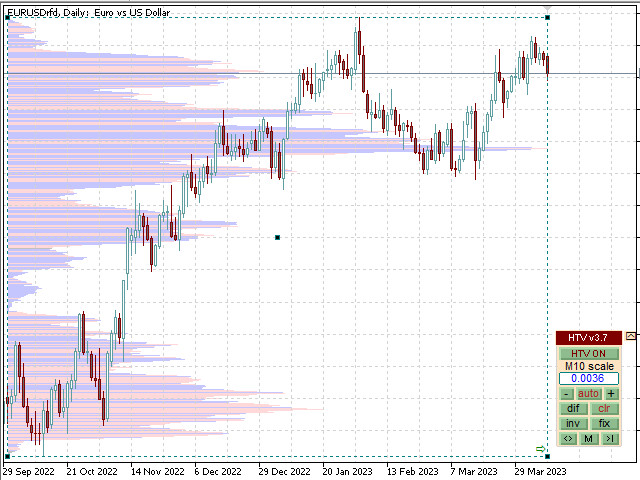
Horizontal tick volumes (HTV)
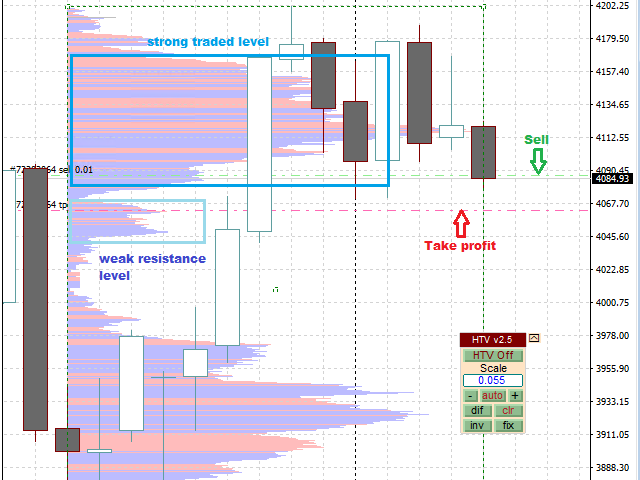
Horizontal tick volumes - an easy and convenient indicator of the horizontal market profile in a user-selected time interval, now also for MT5. It has fast dynamics of displaying horizontal tick volumes on the chart. Produces a visual image of strong trading levels by maximum peaks past volumes and trading direction by color (sell or buy), and also allows you to detect smaller trading levels by differentiating past volumes.
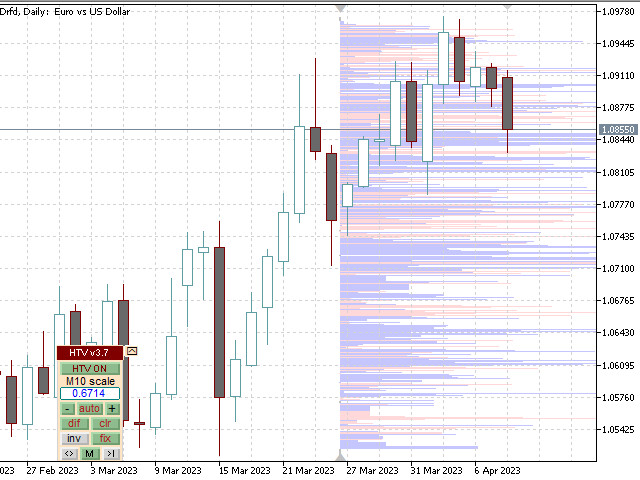
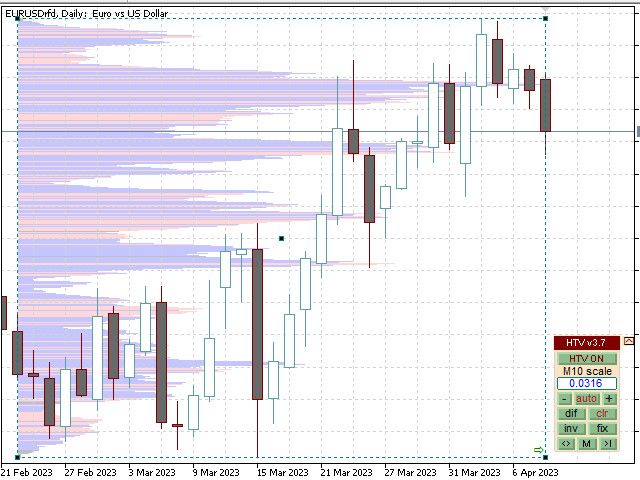
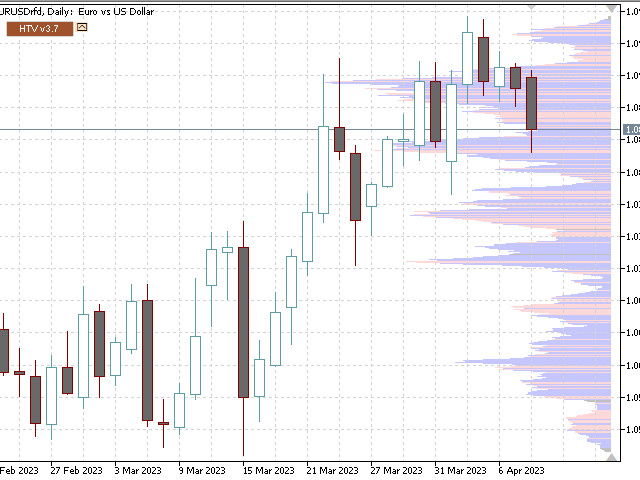
In the "Optimal" mode, when displayed on chart periods up to and including "H1", the data of one-minute bars are used, on H4 - five-minute ones, starting from the "D1" period, the data of hourly bars are used in the calculations. You can also choose any time frame for calculations, not exceeding the current one.
In the MT5 tester, the functions of moving panels do not work normally and the rectangle-area for selecting the boundaries of the plotting time interval is blocked for moving/changing. For review, you can use the trial version, download links (not clickable, select and copy manually) are in the comments to the video. You can also use a similar product for MT4, it works fully in the tester (except for the smooth "behavior" as in real mode).