JP NEW Bollinger Bands MT5
- Indicatori
- Sekar Govinthan
- Versione: 1.0
- Attivazioni: 5
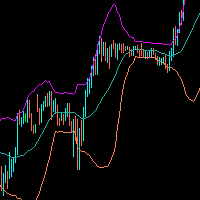
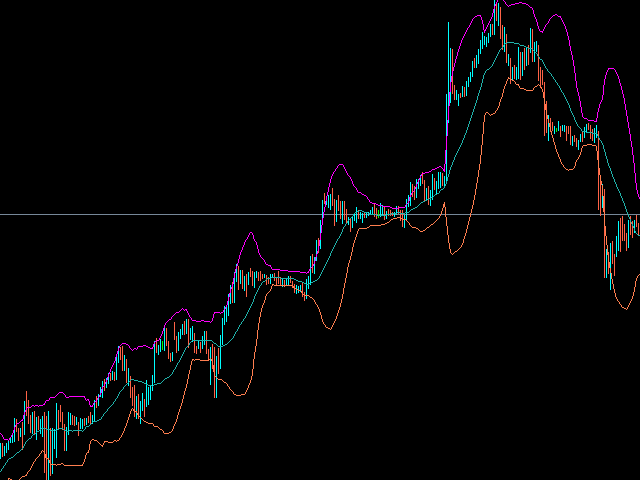
Bollinger Bands are a technical analysis tool that consists of a set of three lines plotted on a price chart. The middle line is a simple moving average, usually of 20 periods, and the upper and lower lines represent the standard deviation of the price from the moving average.
The upper band is calculated by adding two standard deviations to the moving average, while the lower band is calculated by subtracting two standard deviations from the moving average. This creates a band around the moving average that represents a range of prices within which most of the price action is expected to occur.
Traders use Bollinger Bands to identify potential overbought or oversold conditions in the market. When the price moves towards the upper band, it may be considered overbought, and when it moves towards the lower band, it may be considered oversold. A price move outside the bands may signal a trend reversal or the start of a new trend.
Bollinger Bands can be used in combination with other technical indicators and analysis tools to make trading decisions, such as identifying potential entry and exit points, setting stop-loss orders, and determining price targets.


