Murrey Math Line
- Indicatori
- Erol Mutlu
- Versione: 1.0
- Attivazioni: 5
Murrey Math Lines
Formula
The Murrey Math Line X is calculated with the help of price movement segment, which, in accordance to Gann, is divided into 9 sections. So, the indicator makes 9 levels in the proportion of 0%, 12.5%, 25%, 37.5%, 50%. 62.5%, 75%. 87.5%, and 100%.
Trading use
The Murrey Math Line X is a complex indicator, which may be applied independently or together with other methods of technical analysis. It has become popular in Russia.
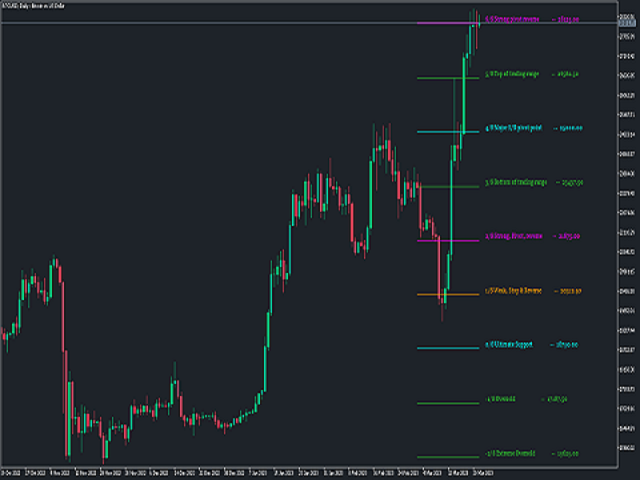
The indicator contains several lines from 0/8 to 8/8. Every line has its own operating conditions. Some of them act as points of price support and resistance, the other ones, as a magnets for price.
Line 1/8. This is a weak line. If a price declines too fast and stops near this line, there is a high possibility that it will reverse upwards. If a price does not stop near this line, it will continue moving to the 0/8 line.
Lines 2/8 and 6/8. These two lines are very strong levels of resistance and support and are inferior only to the 4/8 line in their ability to reverse the price movement.
Line 3/8. If a price is below this line and goes up, so it will be difficult for it to break this level. If a price hits the level of 3/8 and stays there for two trading weeks, so it will stay above the line and spend some time moving in the 3/8-5/8 corridor.
Line 4/8. This is a key line; it provides the best support or resistance.
Line 5/8. If a price moves around the 5/8 line and stays near this line for about two trading weeks, so the best selling level is between the 3/8 and 5/8 lines. In case a price falls below the 5/8 line, it will probably will drop further until the next resistance level.
Line 7/8. This is the weakest resistance/support level. If a price slides too fast and stops at this level, it is likely to reverse downwards. In case a price does not stop near the line, it will move up to the 8/8 line.
Lines 8/8 and 0/8. These are the strongest levels; they provide great resistance and support.


