• Panoramica
  • Recensioni
  • Commenti
  • Novità

Only Line mt4

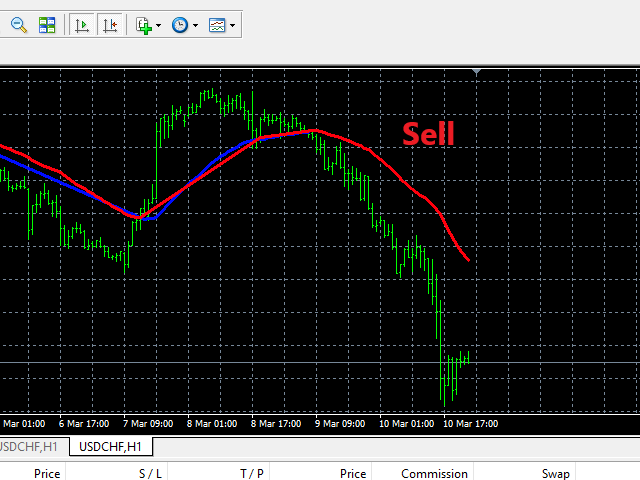
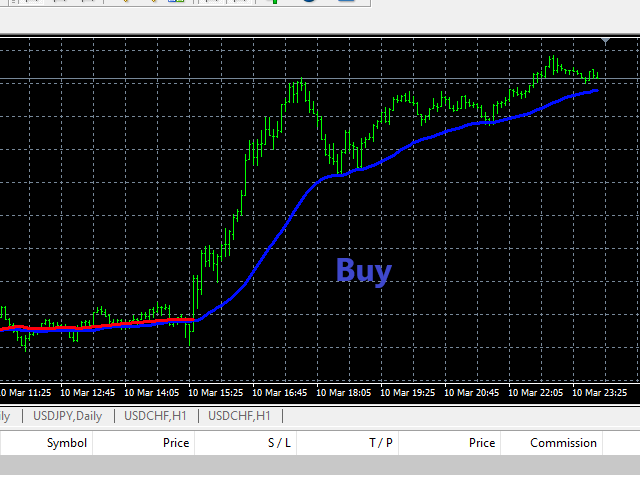
Use this indicator to help determine when to open buys or sells based on the color of the line.

Excellent for scalping.

Settings:

Deviation.

TrendPeriod.

Features Alerts.

How to use:

Simply attach to any chart with default settings.

When used on lower timeframes (M1,M5,M30,H1), confirm on higher timeframes. 

Buy: 

Blue line below price.

Best results when line is blue on multiple timeframes.

Sell:

Red line above price.

Best results when line is red on multiple timeframes.


Or change settings, backtest and use as you see fit for your strategy.

Best results on Major Pairs, but can also be used on other pairs.


Important to note:

  • Please do not use this indicator haphazardly. Make sure it compliments your strategy.

  • Don't risk money you cannot afford to lose.

  • You use this indicator at your own risk. Please apply money management wisely.

  • Always test your strategy on a demo account before using a new indicator on a live account.


Prodotti consigliati
Trendiness Index
Libertas LLC
5 (3)
"The trend is your friend" is one of the best known sayings in investing, because capturing large trendy price movements can be extremely profitable. However, trading with the trend is often easier said than done, because many indicators are based on price reversals not trends. These aren't very effective at identifying trendy periods, or predicting whether trends will continue. We developed the Trendiness Index to help address this problem by indicating the strength and direction of price trend
Matrixs
Andriy Sydoruk
Matrix is a Forex arrow indicator. Displays signals simply and clearly! The arrows show the direction of the transaction, and are colored accordingly, which can be seen in the screenshots. As you can see, trading with such an indicator is easy. I waited for an arrow to appear in the desired direction - I opened a deal. An arrow formed in the opposite direction - closed the deal. The indicator also displays the lines with the help of which the arrow signals are formed, taking into account the int
Owl smart levels
Sergey Ermolov
4.28 (36)
Versione MT5  |  FAQ L' indicatore Owl Smart Levels   è un sistema di trading completo all'interno dell'unico indicatore che include strumenti di analisi di mercato popolari come i   frattali avanzati di Bill Williams , Valable ZigZag che costruisce   la corretta struttura a onde   del mercato, e i   livelli di Fibonacci che segnano i livelli esatti di entrata nel mercato e luoghi per prendere profitti. Descrizione dettagliata della strategia Istruzioni per lavorare con l'indicatore Consulente-
Master Scalping M1 è un indicatore innovativo che utilizza un algoritmo per determinare il trend in modo rapido e preciso. L'indicatore calcola il tempo di apertura e chiusura delle posizioni, gli algoritmi dell'indicatore consentono di trovare i momenti ideali per entrare in un trade (acquistare o vendere un asset), il che aumenta il successo delle transazioni per la maggior parte dei trader. Vantaggi dell'indicatore: Facile da usare, non sovraccarica il grafico con informazioni inutili. Può es
VR Cub
Vladimir Pastushak
VR Cub è un indicatore per ottenere punti di ingresso di alta qualità. L'indicatore è stato sviluppato per facilitare i calcoli matematici e semplificare la ricerca dei punti di ingresso in una posizione. La strategia di trading per la quale è stato scritto l'indicatore ha dimostrato la sua efficacia per molti anni. La semplicità della strategia di trading è il suo grande vantaggio, che consente anche ai trader alle prime armi di commerciare con successo con essa. VR Cub calcola i punti di apert
Trade with Gann on your side!! MASTER CIRCLE 360 CIRCLE CHART, originally created by Gann admitted that this is “The Mother of all charts”. It is one of the last studies that this great trader left for us. The numeric tab le is apparently quite simple like all the tables and is based on square numbers, the SQUARE OF 12 and is by evolution, one of the most important square numbers. Here we can find CYCLE, PRICE AND TIME thanks to angles and grades, to show past and future support and resistance.
Infinity Trend Pro
Yaroslav Varankin
1 (1)
This is a trend indicator without redrawing Developed instead of the binary options strategy (by the color of the Martingale candlestick) Also works well in forex trading When to open trades (binary options) A signal will appear in the place with a candle signaling the current candle It is recommended to open a deal for one candle of the current timeframe M1 and M5 When a blue dot appears, open a deal up When a red dot appears, open a trade down. How to open trades on Forex. When a signal is rec
Trend Oscillator - è un indicatore Crypto_Forex personalizzato avanzato, uno strumento di trading efficiente! - Viene utilizzato un nuovo metodo di calcolo avanzato - 20 opzioni per il parametro "Prezzo per calcolo". - L'oscillatore più fluido mai sviluppato. - Colore verde per i trend al rialzo, colore rosso per i trend al ribasso. - Valori di ipervenduto: inferiori a 5, valori di ipercomprato: superiori a 95. - Ci sono molte opportunità per aggiornare anche le strategie standard con questo i
Stratos Pali
Michela Russo
5 (1)
Stratos Pali Indicator   is a revolutionary tool designed to enhance your trading strategy by accurately identifying market trends. This sophisticated indicator uses a unique algorithm to generate a complete histogram, which records when the trend is Long or Short. When a trend reversal occurs, an arrow appears, indicating the new direction of the trend. Important Information Revealed Leave a review and contact me via mql5 message to receive My Top 5 set files for Stratos Pali at no cost! Dow
Gann Square of 144
Taras Slobodyanik
5 (5)
The Gann Box (or Gann Square) is a market analysis method based on the "Mathematical formula for market predictions" article by W.D. Gann. This indicator can plot three models of Squares: 90, 52(104), 144. There are six variants of grids and two variants of arcs. You can plot multiple squares on one chart simultaneously. Parameters Square — selection of a square model: 90 — square of 90 (or square of nine); 52 (104) — square of 52 (or 104); 144 — universal square of 144; 144 (full) — "full" v
What are Heiken Ashi Candles? Heiken Ashi, derived from the Japanese term 'Heikin Ashi,' translates to average price bars. It's an indicator depicting price bars on a chart. Formula for Heiken Ashi candles: - Heiken Ashi opening price: (previous candle's opening + closing price) / 2 - Closing price Heiken Ashi: (opening + high + low + closing) / 4 - Heiken Ashi peak: Max of high, opening, or closing price - Heiken Ashi bottom price: Min of low, opening, or closing price How to Read Heiken A
Noize Absorption Index MT4
Ekaterina Saltykova
5 (1)
Noize Absorption Index - is the manual trading system that measures the difference of pressure between bears forces and bulls forces. Green line - is a noize free index that showing curent situation. Zero value of index shows totally choppy/flat market.Values above zero level shows how powerfull bullish wave is and values below zero measures bearish forces.Up arrow appears on bearish market when it's ready to reverse, dn arrow appears on weak bullish market, as a result of reverse expectation. S
Laguerre SuperTrend Clouds adds an Adaptive Laguerre averaging algorithm and alerts to the widely popular SuperTrend indicator. As the name suggests, Laguerre SuperTrend Clouds (LSC) is a trending indicator which works best in trendy (not choppy) markets. The SuperTrend is an extremely popular indicator for intraday and daily trading, and can be used on any timeframe. Incorporating Laguerre's equation to this can facilitate more robust trend detection and smoother filters. The LSC uses the impro
Inguz 4
Maxim Kuznetsov
Ing (inguz,ingwar) - the 23rd rune of the elder Futhark ᛝ, Unicode+16DD. Add some runic magic to your trading strategies. The correct marking of the daily chart will indicate to you the successful moments for counter-trend trading. Simple to use, has high efficiency in volatile areas. Be careful in lateral movements. Signals ᛝ are generated when the main lines of construction intersect. Red arrow down - recommended sales Blue up arrow - recommended purchases rare purple arrows indicate exce
Stepping Trend
Mpendulo Chiliza
The Stepping Trend Indicator     The Steppi ng Trend indicator uses the  average true range  (ATR indicator) in its calculation. This gives you control to set your own average true range period, I set the Default as 10.   Indicator Details. Green Arrow Up: This means you are at the starting point of a new bullish trend, it’s time to buy.   Red  Arrow  Down : This means you are at the starting point of a new  bearish  trend, it’ s time to sell .   What if you miss the Arrow Signal?   No prob
Daily Candle Predictor è un indicatore che prevede il prezzo di chiusura di una candela. L'indicatore è destinato principalmente all'uso sui grafici D1. Questo indicatore è adatto sia per il trading forex tradizionale che per il trading di opzioni binarie. L'indicatore può essere utilizzato come sistema di trading autonomo o può fungere da aggiunta al sistema di trading esistente. Questo indicatore analizza la candela corrente, calcolando alcuni fattori di forza all'interno del corpo della cande
The indicator displays the data of the Stochastic oscillator from a higher timeframe on the chart. The main and signal lines are displayed in a separate window. The stepped response is not smoothed. The indicator is useful for practicing "manual" forex trading strategies, which use the data from several screens with different timeframes of a single symbol. The indicator uses the settings that are identical to the standard ones, and a drop-down list for selecting the timeframe. Indicator Paramet
Indicator function This index buys and sells according to the color, using time is one hour,Please run the test on a 30-minute cycle It is best to use 1H for testing   About update questions In order to be more suitable for market fluctuations, the company regularly updates the indicators   Product cycle and trading time applicable to indicators Applicable mainstream currency pair EUR/USD GBP/USD NZD/USD AUD/USD USD/JPY USD/CAD USD/CHF Applicable mainstream cross currency pair EUR/JPY EUR/GBP E
The Perspective Trend indicator tracks the market trend with very high reliability. All intersection points will be ideal points at which the direction of the trend changes. Sharp price fluctuations, as well as noise around averaged prices, are ignored. Signal points, places where color changes, can be used as points of potential market reversal. The indiuctor algorithm implements a kind of technical analysis based on the idea that the market is cyclical in nature. This development can be used b
Trend Deviation
VLADISLAV AKINDINOV
Trend indicator with calculation of dynamic levels and signaling their intersection. Description of input parameters: StepTF = true; - Calculation of the indicator by closing the bar (true) or by each tick (false) BarsCount = 300; - Number of settlement bars Price = PRICE_CLOSE; - Type of price used TimeFrame = PERIOD_CURRENT; - Estimated timeframe TrendPeriod = 9; - Trend calculation period TrendDeviations = 4.9; - coefficient of deviation PeriodTrendSmooth = 1; - Trend smoothing perio
PipFinite Trend PRO
Karlo Wilson Vendiola
4.88 (2246)
Breakthrough Solution For Trend Trading And Filtering With All Important Features Built Inside One Tool! Trend PRO's smart algorithm detects the trend, filters out market noise and gives entry signals with exit levels. The new features with enhanced rules for statistical calculation improved the overall performance of this indicator. Important Information Revealed Maximize the potential of Trend Pro, please visit www.mql5.com/en/blogs/post/713938 The Powerful Expert Advisor Version Automatin
Fibonacci retracement and extension line drawing tool Fibonacci retracement and extended line drawing tool for MT4 platform is suitable for traders who use  golden section trading Advantages: There is no extra line, no too long line, and it is easy to observe and find trading opportunities Trial version: https://www.mql5.com/zh/market/product/35884 Main functions: 1. Multiple groups of Fibonacci turns can be drawn directly, and the relationship between important turning points can be seen
TWO PAIRS SQUARE HEDGE METER INDICATOR Try this brilliant 2 pairs square indicator It draws a square wave of the relation between your two inputs symbols when square wave indicates -1 then it is very great opportunity to SELL pair1 and BUY Pair2 when square wave indicates +1 then it is very great opportunity to BUY pair1 and SELL Pair2 the inputs are : 2 pairs of symbols         then index value : i use 20 for M30 charts ( you can try other values : 40/50 for M15 , : 30 for M30 , : 10 for H1 ,
Alpha Trend sign has been a very popular trading tool in our company for a long time. It can verify our trading system and clearly indicate trading signals, and the signals will not drift. Main functions: Based on the market display of active areas, indicators can be used to intuitively determine whether the current market trend belongs to a trend market or a volatile market. And enter the market according to the indicator arrows, with green arrows indicating buy and red arrows indicating se
Super Reversal Pattern
Parfait Mujinga Ndalika
Super Reversal Pattern Indicator Unlock the power of advanced pattern recognition with our Super Reversal Pattern Indicator. Designed for traders seeking precision and reliability, this indicator identifies one of the most effective reversal patterns in technical analysis, offering a significant edge in your trading strategy. Key Features: Non-Repainting Accuracy: Enjoy the confidence of non-repainting technology. Once a Super Reversal Pattern is detected, it remains static, providing consiste
Quantum Heiken Ashi PRO MT4
Bogdan Ion Puscasu
4.33 (6)
Presentazione del       Grafici   Quantum Heiken Ashi PRO Progettate per fornire informazioni chiare sulle tendenze del mercato, le candele Heiken Ashi sono rinomate per la loro capacità di filtrare il rumore ed eliminare i falsi segnali. Dì addio alle confuse fluttuazioni dei prezzi e dai il benvenuto a una rappresentazione grafica più fluida e affidabile. Ciò che rende il Quantum Heiken Ashi PRO davvero unico è la sua formula innovativa, che trasforma i dati tradizionali delle candele in barre
EZZ Elite Zig Zag is an indicator for the MetaTrader 4 terminal. This indicator traces the peak of the trend based on the market reversal, thus showing various opportunities in the financial market. EZZ Elite Zig Zag is a visual tool, intuitive, and easy to understand and use.  Test it Yourself by Downloading it for Free. Author Paulo Rocha all rights reserved
The Th3Eng PipFinite indicator is based on a very excellent analysis of the right trend direction with perfect custom algorithms. It show the true direction and the best point to start trading. With StopLoss point and Three Take Profit points. Also it show the right pivot of the price and small points to order to replace the dynamic support and resistance channel, Which surrounds the price. And Finally it draws a very helpful Box on the left side on the chart includes (take profits and Stop loss
Point61 Indicator
Evgeniy Machok
5 (1)
The Point61 indicator is the result of many years of monitoring of price behavior of currency pairs and metals. It is not a secret, that in times of uncertainty, traders are looking for possible levels of support and resistance - the point, where price should stop its movement. There are 2 possible scenarios at these points: 1. Reverse (correction) to the opposite direction; 2. Breakthrough to continue movement. Very often these points are used to set stop orders - TakeProfit or StopLoss
An indicator of pattern #31 ("Long Island") from Encyclopedia of Chart Patterns by Thomas N. Bulkowski. The second gap is in the opposite direction. Parameters: Alerts - show alert when an arrow appears   Push - send a push notification when an arrow appears (requires configuration in the terminal) GapSize - minimum gap size in points ArrowType - a symbol from 1 to 17 ArrowVShift - vertical shift of arrows in points   ShowLevels - show levels ColUp - color of an upward line ColDn - color of a
Gli utenti di questo prodotto hanno anche acquistato
Gann Made Easy
Oleg Rodin
4.79 (109)
Gann Made Easy è un sistema di trading Forex professionale e facile da usare che si basa sui migliori principi del trading utilizzando la teoria di mr. WD Gann. L'indicatore fornisce segnali ACQUISTA e VENDI accurati, inclusi i livelli di Stop Loss e Take Profit. Puoi fare trading anche in movimento utilizzando le notifiche PUSH. Vi prego di contattarmi dopo l'acquisto! Condividerò i miei consigli di trading con te e fantastici indicatori bonus gratuitamente! Probabilmente hai già sentito parlar
Dynamic Forex28 Navigator
Bernhard Schweigert
5 (4)
Dynamic Forex28 Navigator - Lo strumento di trading Forex di nuova generazione. ATTUALMENTE SCONTATO DEL 49%. Dynamic Forex28 Navigator è l'evoluzione dei nostri indicatori popolari di lunga data, che combinano la potenza di tre in uno: Advanced Currency Strength28 Indicator (695 recensioni) + Advanced Currency IMPULSE con ALERT (520 recensioni) + CS28 Combo Signals (Bonus). Dettagli sull'indicatore https://www.mql5.com/en/blogs/post/758844 Cosa offre l'indicatore di forza di nuova generazione?
-   Real price is 80$   - 40% Discount ( It is 49$ now ) - Lifetime update free Contact me for instruction, add group and any questions! Related Products:  Bitcoin Expert , Gold Expert - Non-repaint - I just sell my products in Elif Kaya profile, any other websites are stolen old versions, So no any new updates or support. Introduction The breakout and retest strategy is traded support and resistance levels. it involves price breaking through a previous level.  The break and retest strategy is
Scalper Inside PRO
Alexey Minkov
4.75 (61)
!SPECIAL SALE!  An exclusive indicator that utilizes an innovative algorithm to swiftly and accurately determine the market trend. The indicator automatically calculates opening, closing, and profit levels, providing detailed trading statistics. With these features, you can choose the most appropriate trading instrument for the current market conditions. Additionally, you can easily integrate your own arrow indicators into Scalper Inside Pro to quickly evaluate their statistics and profitability
FX Levels MT4
Daniel Stein
5 (2)
FX Levels: Supporti e Resistenze di Precisione Eccezionale per Tutti i Mercati Panoramica Rapida Cercate un modo affidabile per individuare livelli di supporto e resistenza in ogni mercato—coppie di valute, indici, azioni o materie prime? FX Levels fonde il metodo tradizionale “Lighthouse” con un approccio dinamico all’avanguardia, offrendo una precisione quasi universale. Basato sulla nostra esperienza reale con i broker e su aggiornamenti automatici giornalieri più quelli in tempo reale, FX
FX Volume
Daniel Stein
4.59 (34)
FX Volume: Scopri il Vero Sentimento di Mercato dalla Prospettiva di un Broker Panoramica Rapida Vuoi portare la tua strategia di trading a un livello superiore? FX Volume ti offre informazioni in tempo reale su come i trader retail e i broker sono posizionati—molto prima che compaiano report in ritardo come il COT. Che tu miri a guadagni costanti o desideri semplicemente un vantaggio più solido sui mercati, FX Volume ti aiuta a individuare grandi squilibri, confermare i breakout e perfezionar
IX Power MT4
Daniel Stein
4.67 (6)
IX Power: Scopri approfondimenti di mercato per indici, materie prime, criptovalute e forex Panoramica IX Power è uno strumento versatile progettato per analizzare la forza di indici, materie prime, criptovalute e simboli forex. Mentre FX Power offre la massima precisione per le coppie di valute utilizzando i dati di tutte le coppie disponibili, IX Power si concentra esclusivamente sui dati di mercato del simbolo sottostante. Questo rende IX Power una scelta eccellente per mercati non correlat
FX Power MT4 NG
Daniel Stein
4.94 (18)
FX Power: Analizza la Forza delle Valute per Decisioni di Trading Più Intelligenti Panoramica FX Power è lo strumento essenziale per comprendere la reale forza delle principali valute e dell'oro in qualsiasi condizione di mercato. Identificando le valute forti da comprare e quelle deboli da vendere, FX Power semplifica le decisioni di trading e rivela opportunità ad alta probabilità. Che tu segua le tendenze o anticipi inversioni utilizzando valori estremi di Delta, questo strumento si adatta
Advanced Supply Demand
Bernhard Schweigert
4.91 (294)
CURRENTLY 26% OFF !! Best Solution for any Newbie or Expert Trader! This indicator is a unique, high quality and affordable trading tool because we have incorporated a number of proprietary features and a new formula. With this update, you will be able to show double timeframe zones. You will not only be able to show a higher TF but to show both, the chart TF, PLUS the higher TF: SHOWING NESTED ZONES. All Supply Demand traders will love it. :) Important Information Revealed Maximize the potentia
Scalper Vault
Oleg Rodin
5 (28)
Scalper Vault è un sistema di scalping professionale che ti fornisce tutto il necessario per scalping di successo. Questo indicatore è un sistema di trading completo che può essere utilizzato dai trader di forex e opzioni binarie. L'intervallo di tempo consigliato è M5. Il sistema fornisce segnali di freccia accurati nella direzione della tendenza. Ti fornisce anche i segnali più alti e più bassi e i livelli di mercato di Gann. Gli indicatori forniscono tutti i tipi di avvisi, comprese le notifi
Chart Patterns All in One
Davit Beridze
4.68 (19)
Prova "Chart Patterns All in One" in modalità demo e ricevi un bonus. Inviami un messaggio dopo averlo testato in modalità demo per ricevere il tuo bonus. Lascia un commento dopo l'acquisto per ricevere 8 indicatori di alta qualità come bonus. L'indicatore Chart Patterns All-in-One aiuta i trader a visualizzare vari modelli di grafici comunemente utilizzati nell'analisi tecnica. Questo indicatore supporta l'identificazione dei possibili comportamenti del mercato, ma non garantisce la redditivit
Currency Strength Exotics
Bernhard Schweigert
4.87 (31)
ATTUALMENTE SCONTATO DEL 20%! La soluzione migliore per qualsiasi principiante o trader esperto! Questo indicatore è specializzato nel mostrare la forza della valuta per qualsiasi simbolo come coppie esotiche, materie prime, indici o futures. È il primo nel suo genere, qualsiasi simbolo può essere aggiunto alla nona riga per mostrare la vera forza della valuta di Oro, Argento, Petrolio, DAX, US30, MXN, TRY, CNH ecc. Si tratta di uno strumento di trading unico, di alta qualità e conveniente pe
Easy Breakout
Mohamed Hassan
5 (9)
After your purchase, feel free to contact me for more details on how to receive a bonus indicator called VFI, which pairs perfectly with Easy Breakout for enhanced confluence!   Easy Breakout is a powerful price action trading system built on one of the most popular and widely trusted strategies among traders: the Breakout strategy ! This indicator delivers crystal-clear Buy and Sell signals based on breakouts from key support and resistance zones. Unlike typical breakout indicators, it levera
Gold Venamax MT4
Sergei Linskii
5 (1)
Gold Venamax : questo è il miglior indicatore tecnico azionario. L'algoritmo dell'indicatore analizza il movimento dei prezzi di un asset e riflette la volatilità e le potenziali zone di ingresso. Caratteristiche dell'indicatore: Questo è un super indicatore con Magic e due blocchi di frecce di tendenza per un trading comodo e redditizio. Sul grafico viene visualizzato il pulsante rosso per cambiare blocco. Magic è impostato nelle impostazioni dell'indicatore, in modo da poter installare l'in
Golden Trend Indicator
Noha Mohamed Fathy Younes Badr
4.9 (10)
Golden Trend indicator  is The best indicator for predicting trend movement this indicator never lags and never repaints and never back paints    and give  arrow buy and sell    before the candle appear  and it will help you and  will make your trading decisions clearer its work on all currencies and  gold and crypto and all time frame This unique  indicator uses very secret algorithms to catch the  trends, so you can trade using this indicator and see the trend clear on charts  manual guide and
Trend Screener
STE S.S.COMPANY
4.78 (93)
Indicatore di tendenza, soluzione unica rivoluzionaria per il trading di tendenze e il filtraggio con tutte le importanti funzionalità di tendenza integrate in un unico strumento! È un indicatore multi-timeframe e multi-valuta al 100% non ridipingibile che può essere utilizzato su tutti i simboli/strumenti: forex, materie prime, criptovalute, indici e azioni. OFFERTA A TEMPO LIMITATO: l'indicatore di screening di supporto e resistenza è disponibile a soli 50$ e a vita. (Prezzo originale 250$) (o
Innanzitutto, vale la pena sottolineare che questo Strumento di Trading è un Indicatore Non-Ridipingente, Non-Ridisegnante e Non-Laggante, il che lo rende ideale per il trading professionale. Corso online, manuale utente e demo. L'Indicatore Smart Price Action Concepts è uno strumento molto potente sia per i nuovi che per i trader esperti. Racchiude più di 20 utili indicatori in uno solo, combinando idee di trading avanzate come l'Analisi del Trader del Circolo Interno e le Strategie di Trading
Gold Stuff
Vasiliy Strukov
4.86 (249)
Gold Stuff è un indicatore di tendenza progettato specificamente per l'oro e può essere utilizzato anche su qualsiasi strumento finanziario. L'indicatore non ridisegna e non è in ritardo. Periodo consigliato H1. Su di esso l'indicatore funziona in modo completamente automatico Expert Advisor EA Gold Stuff. Lo trovi nel mio profilo. I risultati in tempo reale possono essere visualizzati qui.  Puoi ottenere una copia gratuita del nostro indicatore Strong Support e Trend Scanner, per favore scriv
TPSpro RFI Levels
Roman Podpora
4.85 (27)
ISTRUZIONI       RUS   -   INGLESE       Si   consiglia di utilizzare con un indicatore       -       TPSpro   TENDENZA PRO -   Versione MT4         Un elemento chiave nel trading sono le zone o i livelli da cui vengono prese le decisioni di acquisto o vendita di uno strumento di trading. Nonostante i tentativi dei principali attori di nascondere la loro presenza sul mercato, lasciano inevitabilmente delle tracce. Il nostro compito era imparare a identificare queste tracce e interpretarle corre
Bull versus Bear
Mohamed Hassan
4.5 (18)
Send us a message after your purchase to receive more information on how to get your  BONUS  for FREE  that works in great combination with Bull vs Bear ! Bull versus Bear is an easy-to-use Forex indicator that gives traders clear and accurate signals based on clear trend retests . Forget about lagging indicators or staring at charts for hours because  Bull vs Bear provides real-time entries with no lag and no repaint, so you can trade with confidence. Bull vs Bear  helps you enter trades durin
Beast Super Signal
Dustin Vlok
4.73 (89)
Alla ricerca di un potente indicatore di trading forex che possa aiutarti a identificare facilmente opportunità di trading redditizie? Non guardare oltre il Super Segnale Bestia. Questo indicatore basato sulle tendenze di facile utilizzo monitora continuamente le condizioni del mercato, cercando nuove tendenze in via di sviluppo o saltando su quelle esistenti. Il Beast Super Signal fornisce un segnale di acquisto o di vendita quando tutte le strategie interne sono allineate e sono al 100% in con
ATTUALMENTE SCONTATO DEL 31%! La soluzione migliore per ogni principiante o trader esperto! Questo indicatore è uno strumento di trading unico, di alta qualità e conveniente perché abbiamo incorporato una serie di caratteristiche proprietarie e una formula segreta. Con un solo grafico fornisce avvisi per tutte le 28 coppie di valute. Immaginate come migliorerà il vostro trading perché sarete in grado di individuare l'esatto punto di innesco di una nuova tendenza o opportunità di scalping! Co
Special offer : ALL TOOLS , just $35 each! New tools   will be   $30   for the   first week   or the   first 3 purchases !  Trading Tools Channel on MQL5 : Join my MQL5 channel to update the latest news from me Scopri la potenza del concetto di Inversion Fair Value Gap (IFVG) di ICT con l’ Indicatore Inversion Fair Value Gaps ! Questo strumento all’avanguardia porta i Fair Value Gaps (FVG) a un livello successivo, identificando e visualizzando le zone di FVG invertite – aree chiave di supporto
PZ Harmonacci Patterns
PZ TRADING SLU
3.17 (6)
Trade smarter, not harder: Empower your trading with Harmonacci Patterns Special Offer: Purchase now to receive free bonuses worth $165! (Read more for details) This is arguably the most complete harmonic price formation auto-recognition indicator you can find for the MetaTrader Platform. It detects 19 different patterns, takes fibonacci projections as seriously as you do, displays the Potential Reversal Zone (PRZ) and finds suitable stop-loss and take-profit levels. [ Installation Guide | Upda
Special offer : ALL TOOLS , just $35 each! New tools   will be   $30   for the   first week   or the   first 3 purchases !  Trading Tools Channel on MQL5 : Join my MQL5 channel to update the latest news from me Presentiamo il rivoluzionario RSI Kernel Optimized with Scanner, uno strumento all'avanguardia che ridefinisce l'analisi RSI tradizionale integrando il potente algoritmo di stima della densità del nucleo (KDE). Questo indicatore avanzato non solo fornisce informazioni in tempo reale sull
System Trend Pro
Aleksandr Makarov
5 (2)
System Trend Pro - This is the best trend trading indicator!!! You can get this indicator for free -  Quantum Entry PRO The indicator no repaint!!!   The indicator has   MTF   mode, which adds confidence to trading on the trend (   no repaint   ). How to trade? Everything is very simple, we wait for the first signal (big arrow), then wait for the second signal (small arrow) and enter the market in the direction of the arrow. (See screens 1 and 2.) Exit on the opposite signal or take 20-30 pips
Legacy of Gann
Pavel Zamoshnikov
4.83 (12)
The indicator very accurately determines the levels of the possible end of the trend and profit fixing. The method of determining levels is based on the ideas of W.D.Gann, using an algorithm developed by his follower Kirill Borovsky. Extremely high reliability of reaching levels (according to K. Borovsky  - 80-90%) Indispensable for any trading strategy – every trader needs to determine the exit point from the market! Precisely determines targets on any timeframes and any instruments (forex, met
Automated Trendlines
Georgios Kalomoiropoulos
5 (16)
Le linee di tendenza sono lo strumento più essenziale di analisi tecnica nel forex trading. Sfortunatamente, la maggior parte dei trader non li disegna correttamente. L'indicatore automatizzato delle linee di tendenza è uno strumento professionale per i trader seri che ti aiuta a visualizzare il movimento di tendenza dei mercati. Esistono due tipi di linee di tendenza, linee di tendenza rialziste e linee di tendenza ribassiste. Nella tendenza rialzista, la linea di tendenza Forex viene tracci
ATTUALMENTE SCONTATO DEL 26% La soluzione migliore per ogni principiante o trader esperto! Questo indicatore è uno strumento di trading unico, di alta qualità e conveniente perché abbiamo incorporato una serie di caratteristiche proprietarie e una nuova formula. Con un solo grafico è possibile leggere la forza delle valute per 28 coppie Forex! Immaginate come migliorerà il vostro trading perché sarete in grado di individuare l'esatto punto di innesco di una nuova tendenza o di un'opportunità
TPSproTREND PrO
Roman Podpora
4.71 (28)
TPSpro TREND PRO   è un indicatore di tendenza che analizza automaticamente il mercato, fornisce informazioni sulla tendenza e sui rispettivi cambiamenti e fornisce segnali per entrare nelle operazioni senza ridisegnare. L'indicatore utilizza ciascuna candela e la analizza separatamente. Si riferisce a vari shock al rialzo o al ribasso. Punto di ingresso preciso per il trading di valute, criptovalute, metalli, azioni e indici! Versione MT5                   Descrizione completa dell'indicatore  
Altri dall’autore
Trend Radar Chart Tracker
Natasha Diedericks
3 (2)
Easily track and trade with the trend using this indicator. Uses a circle and line to indicate the trend direction. Excellent for channels. Features alert function. Parameter TrendPeriod can be changed to your preference. How to use: Simply attach to any chart. Blue circle plus blue line cross below price = Buy. Red circle plus red line  cross above price = Sell. Best results when taking higher time frames into consideration before entering a trade. (Hint: Wait for the radar/circle to appear on
FREE
SR Arrows mt5
Natasha Diedericks
This indicator gives you arrows, two SR lines and a golden trend line. Uses a special trend algorithm to plot the arrows, combined with support and resistance inputs. Perfect for channel trading. Features alert functions. Parameter TrendArrowPeriod. Parameter TrendLinePeriod. (Change to your preference) How to use: Simply attach to any chart with default settings. Zoom in the chart, to see the two blue SR lines and arrows more clearly. When the blue SR line is below the price, golden trend line
ZigZag Bullets
Natasha Diedericks
5 (1)
This indicator takes input from the ZigZag and ADX indicators, combined with a special trend algorithm. You also get a Moving Average on the chart to determine trend direction. Great for scalping. Perfect for channels. Features alert functions. BulletPeriod. Parameter TrendLinePeriod for the MA line. Change to your preference. Try 200. How to use: Simply attach to any chart. Sell on red bullets, with red MA line above price. Enter on bullets closest to this line. Buy on blue bullets, with blue
Trend Alligator
Natasha Diedericks
5 (1)
This indicator takes input from the Alligator indicator. Great for scalping. Great for identifying new trends. This indicator can be used on all time frames and pairs. Features alert functions. Parameters: Alerts JawsPeriod JawsShift TeethPeriod TeethShift LipsPeriod LipsShift How to use: Simply attach to any chart with default settings. Sell when all 3 red lines cross above white line. Buy when all 3 blue lines cross below white line. Best results when checking the higher time frames (3 or mo
Trend SR
Natasha Diedericks
This indicator takes input from Support and Resistance levels, combined with a special trend filter. Easily spot tops and bottoms, and trade with more confidence. Great for scalping or long-term trading. This indicator can be used on all time frames and pairs. Features alert function. No need to set up the indicator. How to use: Simply attach to any chart. Red histogram line color = Selling opportunities. Blue histogram line color = Buying opportunities. See pictures below. To spot highs/tops a
SR Arrows
Natasha Diedericks
This indicator gives you arrows, two SR lines and a white trend line. Uses a special trend algorithm to plot the arrows, combined with support and resistance inputs. Perfect for channel trading. Features alert functions. Parameter TrendArrowPeriod. Parameter TrendLinePeriod. (Change to your preference) How to use: Simply attach to any chart with default settings. Zoom in the chart, to see the two blue SR lines and arrows more clearly. It is very important to wait for a new blue SR line to appear
This indicator gives you a modified version of three Moving Averages. Great for scalping. Does not feature any alerts, and is best used manually after confirming multi line displays. Settings: Period1  Period2 Period3 Period4 How to use: Simply attach to any chart with default settings. Buy when the 4 lines converge below the price. Sell when the 4 lines converge above the price. Take note of the slope of Period4. See example pictures below. Best results when looking at three or more time frame
MTF Moving Trender
Natasha Diedericks
This indicator displays a modified version of Moving Averages for multiple time frames: Current (TF indicator is attached to), M5, M15, M30, H1, H4, Daily, Weekly and Monthly. NB: Make sure to download currency history before testing and use. No need to set up the indicator. Features an audible alert function for the current chart's line. How to use: Simply attach to M5 chart. Hover over the lines to see the line's time frame. Buy when more than two MTF lines cross closely together below the pri
ZigZag Sniper
Natasha Diedericks
This indicator gives you a modified ZigZag, combined with a special algorithm. Great for scalping. Perfect for channel trading. Parameter TrendPeriod. Features alert functions.  How to use: Simply attach to any chart with default settings. Buy when the line crosses below the price, and blue arrow. Sell when the line crosses above the price, and red arrow. It helps to keep the audible alert set to true. Best results when checking two or more timeframes before entering trades. (See comment #1 for
This indicator gives you PSar crossings in the form of blue and yellow dots on the chart, as well as a Moving Average. Parameters: MAPeriod (Change to your preference) Alerts PSarStep PSarShift PSarMaximum How to use: Simply attach to any chart with default settings. Sell on yellow dots, with white MA line above price.  Buy on blue dots, with white MA line below price. Best results when checking the higher time frames before entering trades. Best results on Major Pairs, but can also be used on o
MTF PSar Trender
Natasha Diedericks
This indicator gives you the PSars for multiple time frames: M1, M5, M15, M30, H1, H4, Daily, Weekly, Monthly. Features Alert function for current Psar. Good results on M5. How to use: Download M1 history for testing. Hover over the different colors to see different timeframes. Simply attach to any chart. Take note of higher time frames before entering trades on lower time frames. (Zoom the H1/H4/Daily chart out completely) Sell when Multiple PSars cross above the price. Example: M1-M5-M15-M30-H
Mountains
Natasha Diedericks
Visual helper for spotting peaks and troughs. Alerts. PSar settings for trend direction determination. Great for scalping. How to use: Simply attach to any chart. To spot peaks and troughs, zoom chart out completely. Sell on red dots. Best results when red dot appears on 3 or more time frames. Buy on blue dots. Best results when blue dot appears on 3 or more time frames. If used on lower timeframes (M1, M5, M15, M30), please make sure to check higher timeframes. Or backtest and use as you see fi
M1 Scalper Mt4
Natasha Diedericks
This indicator is excellent for scalping on the M1 or M5 chart. Uses a special algorithm for the lines. No need to set up the indicator. Does not feature any alerts and is best used manually after visually confirming the line displays. NB: Make sure to download M1 history before testing and use. How to use: Simply attach to M1 or M5 chart. Zoom chart out completely. Sell when all lines above the white line (PriceLine). Sniper line crosses above white line. Buy when all lines below the white lin
Easily track how the price moves in a separate indicator window with this trend indicator. Great for scalping or long-term trading. Helps you find best entry points for your trades after reaching a certain level, and easily identify where you can exit your trades. This indicator can be used on all time frames and pairs. Features alert function. No need to set up the indicator. How to use: Simply attach to any chart. NB : Look to the extreme zones (oversold/overbought) when looking for new trade
Multi RSI Pro mt4
Natasha Diedericks
5 (1)
This indicator takes input from the RSI from multiple time frames (M/W/D/H4/H1), and presents the output on the main chart. Great for scalping. Features alerts for the current chart's TrendLine above or below price. TrendLine period setting. Multi RSI period settings. How to use: Simply attach to M5 (Scalping - zoom chart out completely on M5) or use on higher time frames' charts. Zoom chart out completely to get a better view of the chart. Hover over the lines to see the time frame applicable.
This indicator takes input from the ADX from multiple time frames (M/W/D/H4/H1), and presents the output on the main chart. Great for scalping. Features alert for current chart's ADX. TrendLine period setting. How to use: Simply attach to any chart. User can set the period for ADX(Monthly, Weekly, Daily, H4, H1,Current chart) Zoom chart out completely. Hover over the lines to see the time frame applicable. Buy when Multi ADX below price; also blue dots and white line below price. Sell when Mult
Price Trender mt4
Natasha Diedericks
This indicator uses a special algorithm to plot the 4 lines for trading. Great for scalping. Features alerts. Settings for trend filters. How to use: Simply attach to any chart with default settings. Buy when the three pink lines converge below the green line. Sell when the three pink lines converge above the green line. Best results when looking at three or more time frames, and the three blue lines have just converged below or above the green line. Use as you see fit for your strategy. Best re
This indicator takes input from the RSI, combined with a trend filter. Great for scalping. Does not feature any alerts and is best used manually. Settings: TrendFilterPeriod RSIPeriod Set these parameters to your preference. How to use: Attach to any chart with default settings. Can be used on any time frame. If used on lower time frames, check higher time frames too. Buy : - Wait for blue histo color to cross above level 50, then open buys. **Best results when checking the higher time frames to
Trend Histo mt4
Natasha Diedericks
This indicator uses 2 trend filters. Great for scalping. Features alerts Settings: TrendFilterPeriod1 TrendFilterPeriod2 How to use: Attach to any chart with default settings, or set to your preference. Can be used on any time frame. If used on lower time frames, check higher time frames too. Buy : - Blue histo color. Sell : - Red histo color. Or backtest and use as you see fit for your strategy. Best results on Major Pairs, but can also be used on other pairs (Metals, Minors). Important to not
Trend Chart mt4
Natasha Diedericks
Displays multiple trend indicators on the main chart. Great for scalping. Settings: LWMA SMA SSMA EMA ADX (red and blue dots), and PSar Alerts for ADX crosses. How to use: Can be used on any time frame.  Buy : - Blue dot first. - Then PSar and 3 MAs cross below price. **Best results when confirming the higher time frames too. Sell : - Red dot first. - Then PSar and 3 MAs cross above price. **Best results when confirming the higher time frames too. Or backtest and use as you see fit for your stra
This indicator takes input from the RSI from multiple time frames (M/W/D/H4/H1/M30), and presents the output as lines above or below the price, on the main chart. Great for scalping. Features alerts for the current time frame's RSI (the Arrows). Settings: RSI period settings for M/W/D/H4/H1/M30/Current. (Set to your preference) PSar settings for trend determination; for current chart's time frame. How to use: Simply attach to M5 (Scalping - zoom chart out completely on M5) or use on higher time
Uses a trend filter to plot the lines and arrows. Great for scalping. Settings: TrendPeriod: change to your preference. Alerts. How to use: Can be used on any time frame. Attached to chart, and wait for arrow to appear on multiple timeframes. Buy : -  Blue arrow and blue line cross below price on multiple time frames; e.g., on D,W,M or H1,H4,Daily or M30,H1,H4 Sell : -  Yellow arrow and red line cross above price on multiple time frames; e.g., on D,W,M   or H1, H4, Daily or  M30,H1,H4 **Best re
Pro Trader mt4
Natasha Diedericks
This indicator takes input from the RSI and a trend filter, and presents the output in a separate indicator window as a histogram. Great for scalping. Settings: No need to set up the indicator. Features Alerts. How to use: Simply attach to any chart Zoom chart in to get a better view of the histo color. Buy:  Blue histo color on multiple timeframes. (e.g,. M30-H1-H4) Sell: Red histo color  across on multiple timeframes. Or backtest and use as you see fit for your strategy. Best results on Major
PTT mt4
Natasha Diedericks
This indicator takes input from the RSI and a trend filter, and presents the output in a separate indicator window as a histogram. Great for scalping. Settings: TrendPeriod RSIPeriod Features Alerts. How to use: Simply attach to any chart Zoom chart in to get a better view of the histo color. Buy:  Blue histo color on multiple timeframes. (e.g,. M30-H1-H4) Sell: Red histo color  across on multiple timeframes. Or backtest and use as you see fit for your strategy. Best results on Major Pairs, but
SLT mt4
Natasha Diedericks
This indicator takes input from a trend filter and 2 oscillators, and presents the output in a separate indicator window as 2 lines and arrows. Great for scalping. Settings: No need to set up the indicator. Features Alerts. How to use: Simply attach to any chart Zoom chart in to get a better view of the lines. Buy:  Blue arrow. Best results when entering buys above the 0.00 level, and confirming on higher timeframes too. Sell: Red arrow. Best results when entering sells below the 0.00 level,   a
ADT mt4
Natasha Diedericks
This indicator takes input from Accumulation/Distribution and a trend filter, and presents the output in a separate indicator window as a histogram. Great for scalping. Settings: TrendPeriod Features Alerts. How to use: Simply attach to any chart with default setting, or set the TrendPeriod to your preference. Zoom chart in to get a better view of the histo color. Buy:  Blue histo color on multiple timeframes. (e.g., M30-H1-H4-D) Sell: Red histo color  on multiple timeframes. Or backtest and us
ADX Trend mt4
Natasha Diedericks
This indicator takes input from the ADX, and presents the output in a separate indicator window as a histogram. Great for scalping. Settings: ADXPeriod Features Alerts. How to use: Simply attach to any chart with default setting, or set the ADXPeriod to your preference. Zoom chart in to get a better view of the histo color. Buy:  Blue histo color on multiple timeframes. (e.g., M30-H1-H4-D) Sell: Red histo color  on multiple timeframes. Or backtest and use as you see fit for your strategy. Best
OBV Trend mt4
Natasha Diedericks
This indicator takes input from the OBV and a trend filter, and presents the output in a separate indicator window as a histogram. Great for scalping. Settings: TrendPeriod Features Alerts. How to use: Simply attach to any chart with default setting, or set the TrendPeriod to your preference. Zoom chart in to get a better view of the histo color. Buy:  Blue histo color on multiple timeframes. (e.g., M15-M30-H1-H4) Sell: Red histo color  on multiple timeframes. Or backtest and use as you see fit
Use this indicator to help determine when to open buys or sells based on the slope and direction of the channel. Excellent for scalping. Settings: TrendPeriod. Deviation. ChannelPeriod. Features Alerts. How to use: Simply attach to any chart. To use on lower timeframes (M1,M5,M30), you'll need to start setting the Deviation from 0.01 and increase it if needed. If used on lower timeframes  ( M1,M5,M30,H1), confirm on higher timeframes (H4,D,W) before entering trades. H1: Set Deviation to 0.5. H4:
This indicator uses a special algorithm to plot the 4 lines for trading. Great for scalping. Does not feature any alerts and is best used manually after confirming the line displays. No need to set up the indicator. How to use: Attach to any chart. Can be used on any time frame. If used on lower time frames, check higher time frames for confirmation. Buy : - Wait for green and white lines to be above the level 50 dotted line, then open buys. - Buy when the green line crosses below the white line
Filtro:
Nessuna recensione
Rispondi alla recensione
Versione 1.1 2023.03.13
Input signal update.