EMA 34 vs EMA 89
- Indicatori
- Nguyen Kong Nguyen
- Versione: 1.2
- Aggiornato: 16 aprile 2023
- Attivazioni: 5
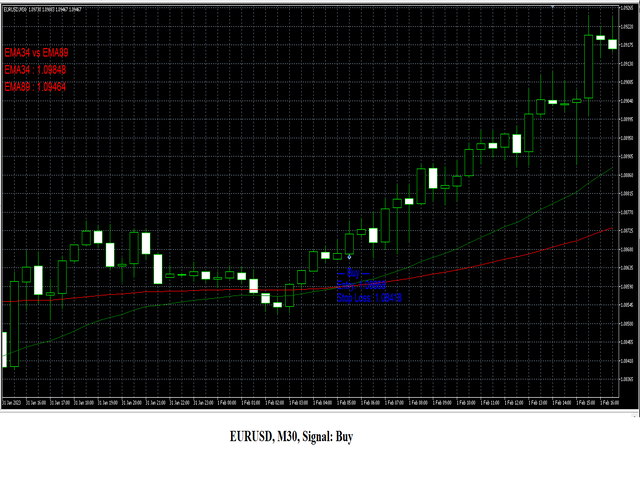
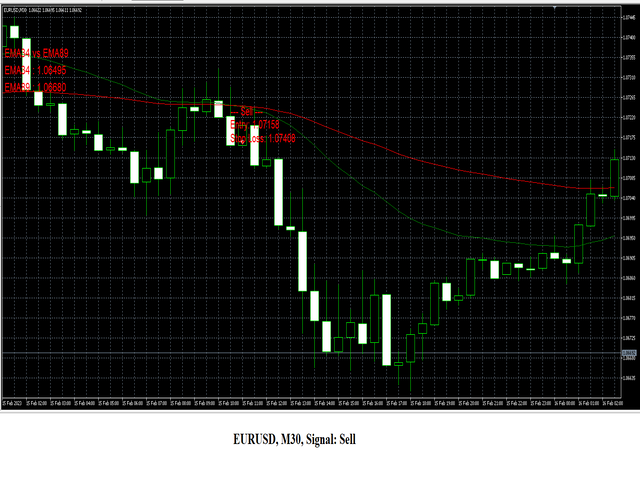
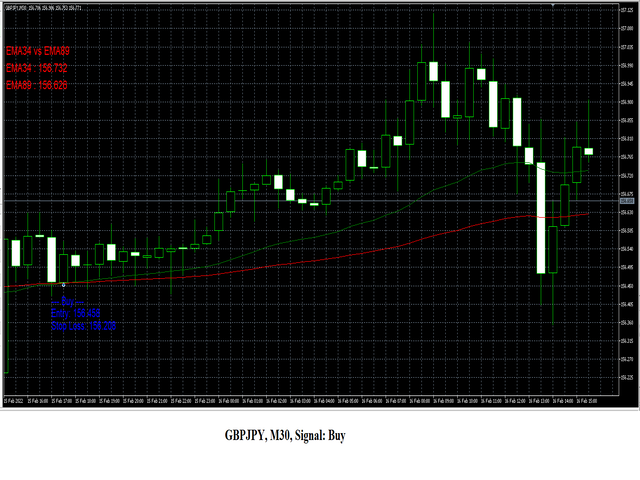
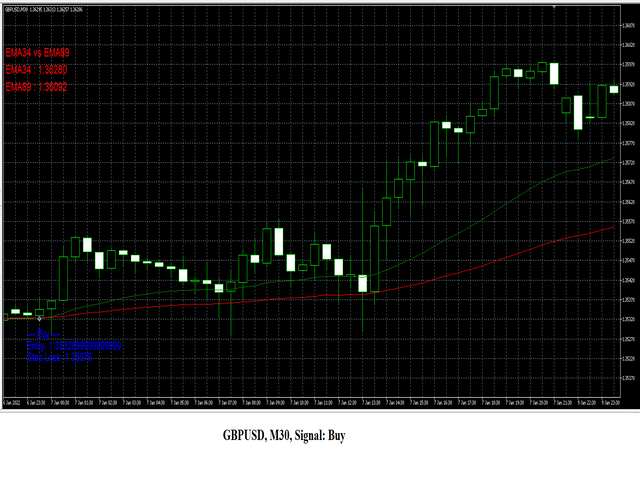
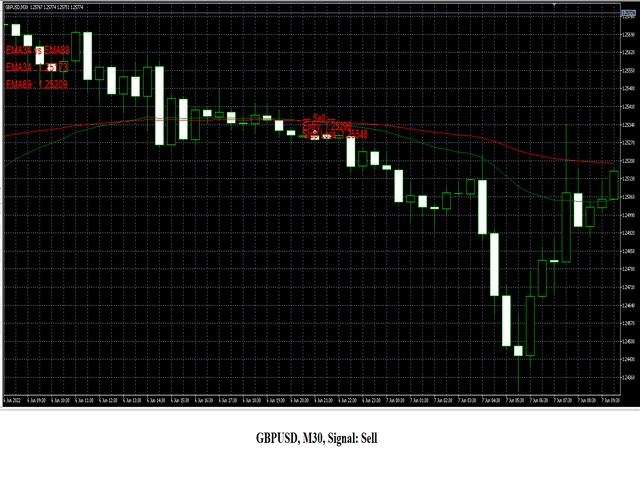
L'indicatore "EMA43 vs EMA89" è uno strumento potente per i trader che cercano di identificare inversioni di tendenza e potenziali opportunità di trading. Questo indicatore mostra due medie mobili, l'EMA34 e l'EMA89, sul grafico. Quando queste medie mobili si incrociano, viene generato un segnale di acquisto o vendita, indicando un potenziale cambiamento nella direzione della tendenza.
Caratteristiche:
Facile da usare: basta attaccare l'indicatore al grafico e iniziare a ricevere avvisi quando l'EMA34 e l'EMA89 si incrociano. Periodi di medie mobili regolabili: regolare la lunghezza dell'EMA34 e dell'EMA89 per adattarli alla propria strategia di trading. Funziona su tutti i time frame: utilizzare l'indicatore EMA Cross Alert su qualsiasi time frame, da M1 a MN. Come usare:
Attaccare l'indicatore EMA Cross Alert al grafico. Attendere che l'EMA34 e l'EMA89 si incrocino. Quando viene generato un segnale di acquisto o vendita, considerare l'ingresso in un trade nella direzione della nuova tendenza. Avviso di rischio: il trading nei mercati finanziari comporta rischi. Le prestazioni passate non sono indicative dei risultati futuri. Effettuare sempre la propria analisi e consultare un professionista finanziario prima di prendere qualsiasi decisione di investimento.
Nota: questo indicatore si basa sulla popolare strategia di crossover dell'EMA e non è uno strumento garantito di profitto. Utilizzarlo in combinazione con altri strumenti di analisi tecnica e la propria strategia di trading per ottenere i migliori risultati.