Top Gun Oscillators
- Indicatori
- Safwan Rushdi Khalil Arekat
- Versione: 1.6
- Aggiornato: 31 maggio 2023
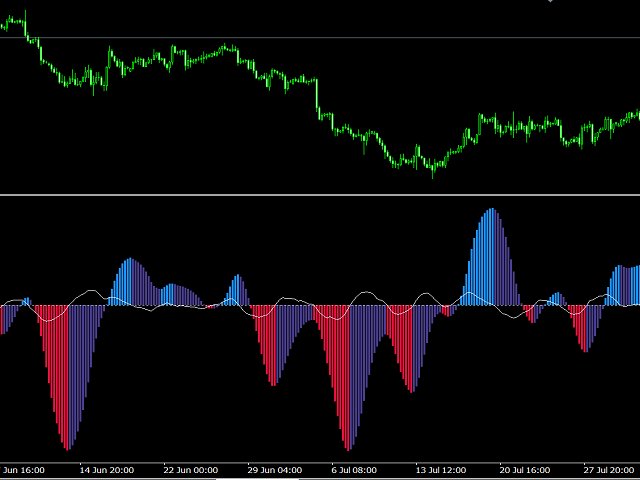
Note: New in 1.6: the indicator now exports the trade signal (but not displayed). Go long with light blue. Go short with red. Exit otherwise. Signal to be imported to your EA using iCustom.
This indicator provides Best of the Best linear filter momentum oscillators that I am aware of (Low Pass Differentiators, LPD's) . All of them are recent developments by this developer, or other researchers. The oscillator line is the first buffer of the indicator, and can be called in other indicators or EA's by iCustoms.
In my previous indicator True Momentum, I briefly described the characteristics of a true momentum oscillator and exposed the weakness of some of the ones used in technical analysis. The oscillator in that indicators was the Biquad LPD, where it was shown to be better than the MACD, but it was not claimed to be the optimal momentum oscillator (hoping there was no misunderstanding). Some of the other oscillators provided here might surpass the performance of the Biquad, as will be shown in this description. The equations for calculating the filters are provided when its is straightforward to do so.This indicator is meant to be educational, as well as being of high utility. So let us dispel some more myths encountered in the field of Technical Analysis. Unfortunately, there are numerous misconceptions in this field, and many times claims are made without proof, or even a proper understanding. We will concentrate here on claims dealing with momentum, they are:
1- The conventional indicator "Momentum Oscillator", being the difference (or ratio) between the the current price and the price p- periods has already been falsified in my preprint here . Momentum is not calculated as the difference in price.
2. Although the MACD possesses some of the required features to fit the description of a momentum oscillator (see my pre-print), this is by accident - not by design. It is not in general true that momentum can be defined as the difference between a fast moving average and a slow moving average.
3. The claim that momentum oscillators are leading indicators needs clarification. The terms "leading" or "lagging" have very specific meanings in the mathematics of oscillations, and in physics. The output of a digital filter always lags the input, as necessitated by the principle of causality. So what is really meant by the MACD, for example, being a leading indicator? Momentum is a quantity related to motion and its direction.As a momentum oscillator, the most important information it can provide is the direction of price. A positive MACD ought to indicate increasing price, while negative means decreasing price. Since price changing direction is one of the most important factor in trading decisions, then the zero-crossing of the MACD line, which supposedly means price changing direction, ought to be the the most important piece of information from this indicator. But if you pay attention to all zero crossings of the MACD (use long periods to minimise volatility effects), you will find that they are always delayed relative to the the price reversal visible on the price chart. They never lead. But the claim of technical analysts is that the VALUE REVERSAL of the oscillator happens before the reversal of price. This could happen, but without certainty. When we consider the reversal of a proper momentum oscillator, we are investigating the acceleration (or deceleration) of price. It is true that acceleration determines the price motion after an interval in time, at the assumption the acceleration is constant or not changing very much - but this is seldom the case. Anyway, the momentum oscillator should be of high quality and very low noise to discern acceleration. But the main MACD line crossing the 9 period signal line is not high quality.
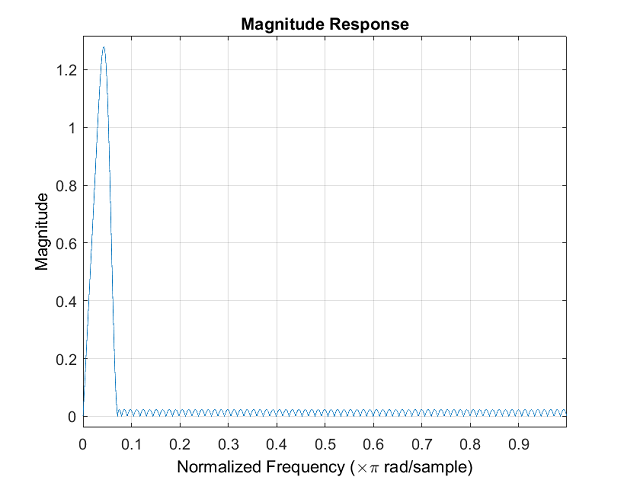
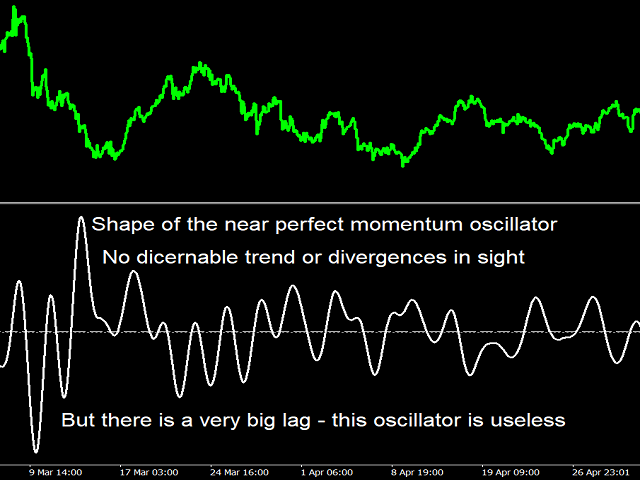
3. A true momentum oscillator does not represent the price itself, rather, it represents the change in the price. So trying to read into the price trend from the momentum oscillator is wrong in principle. The reason that there is remnant info of the trend (like tops or bottoms) has to do with the the "leakage" of the filter. All this info should have been removed by the momentum oscillator. Consider the filter having the near perfect frequency response shown in screenshot 2, this filter was designed by Matlab's Filter Design App in the Signal Processing utility. The oscillator given by this filter is shown in screenshot 3, Only smooth curving lines are visible, there is no information about trend. But notice how much lagging this oscillator is relative to the price itself. It has a perfect momentum oscillator shape, but it is useless because of the large lag. Those who try to read the trend from a momentum oscillator are milking the sickly cow. (This does not apply to my Biquad High Pass Filter , whose purpose is to accentuate divergences and small/medium range trends, or to the RSI for example, because the RSI is not a momentum oscillator as erroneously considered, but is a high pass filter detrender).
4. Because trend-following is meaningless for a momentum oscillator, and because all tops and bottoms should disappear in a good oscillator, then it follows that following divergences is not a good practice. Again, here one is trying to read from undiscarded refuse.
5. Does the slope of a moving average indicate momentum ? Yes ! But the moving average (or low pass filter) must satisfy the crucial condition of having flat pass-bands in its magnitude frequency response. For example, none of the standard averages SMA, EMA or LWMA have flat passbands. If you have the time, please install and play with my Quick n Dirty Frequency Response indicator.
The take from this discussion is this: Only zero crossings and oscillator value reversals have a well established meaning. If the momentum oscillator is of high quality (i.e. linear frequency rise, low noise, and low lag.), then it becomes an effective tool for trading.
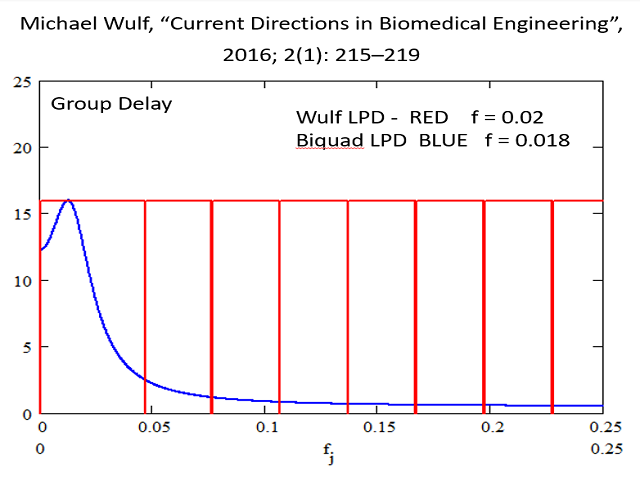
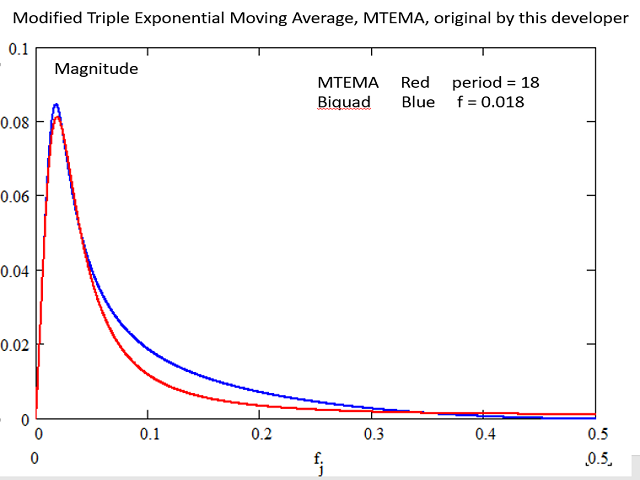
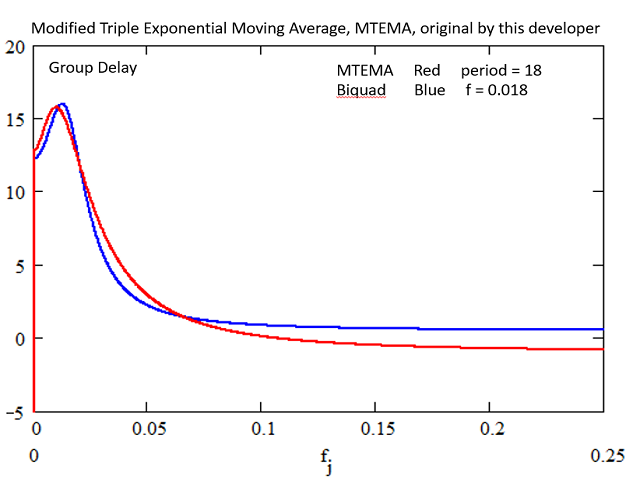
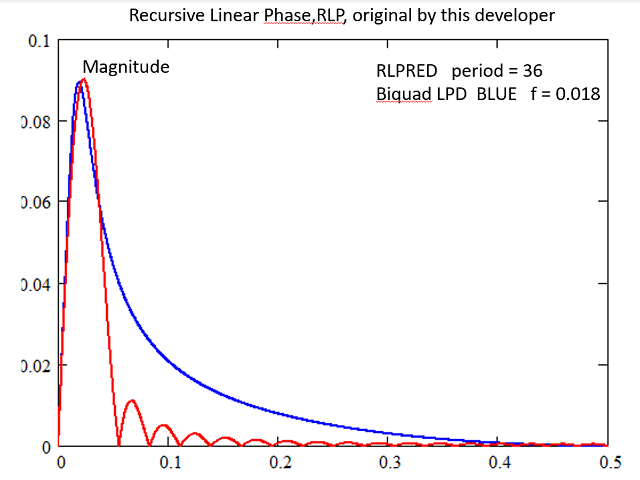
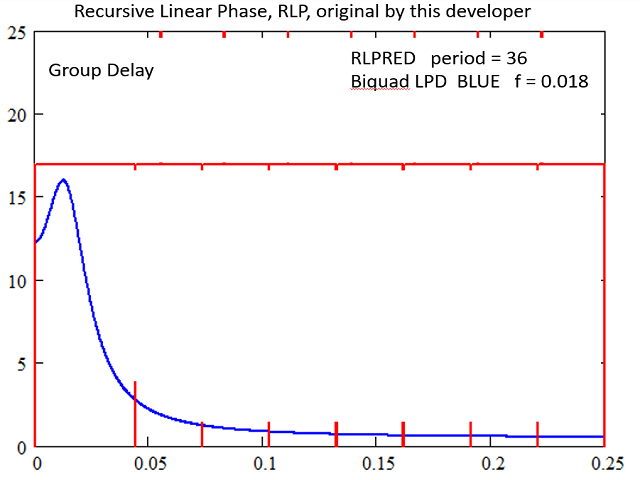
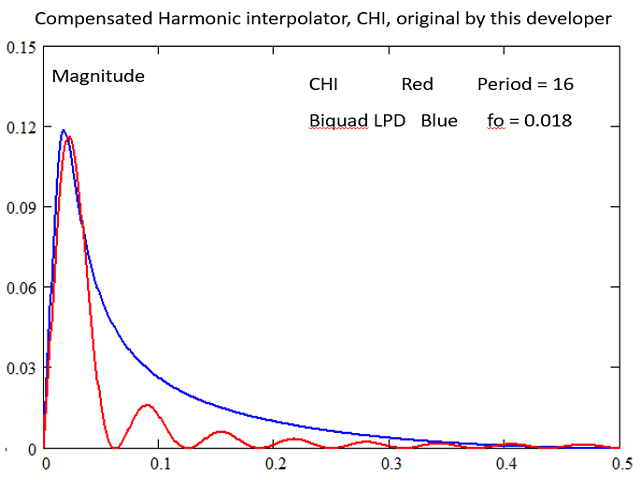
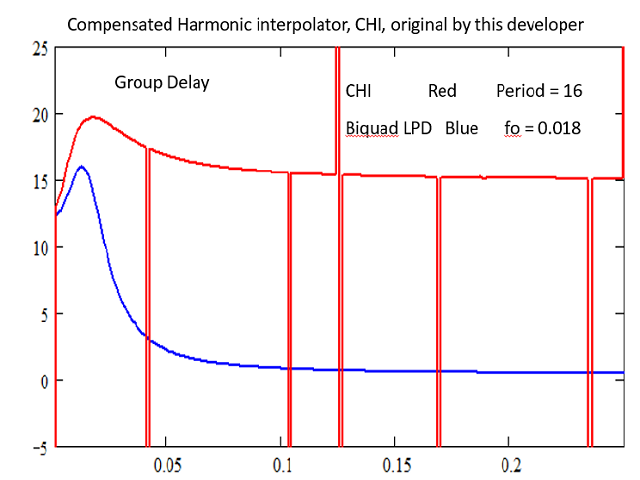
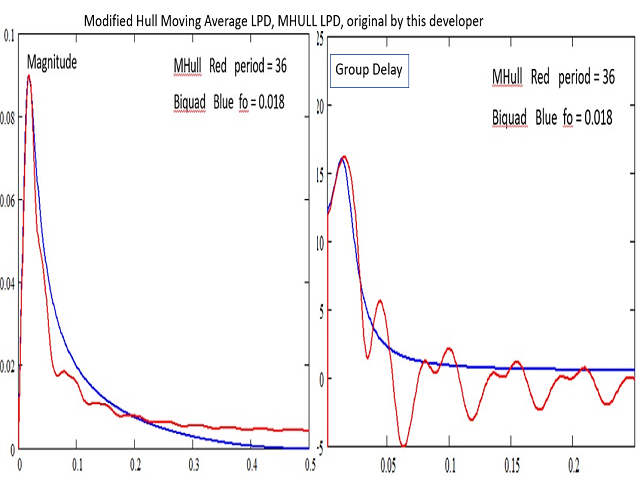
In presenting the momentum oscillators of this indicator, we will use the Biquad LPD as a reference for comparison. The screen shots display the magnitude and group delay response of each of the oscillator of this indicator compared to the reference biquad. All periods and settings are selected to give a response similar to the MACD(12,26). But the actual best parameters for each filter are of course a subject of optimisation. The response of the MACD and Awesome oscillator have been disclosed in my previous product True Momentum.
Now ! Which one is best ?! Obviously, they are all superior to MACD and Awsome oscillator at suppressing high frequency volatility. And this does not come at a cost in lag. However, when the five are compared to each other, a trade off is seen. Maybe MTEMA offers the best plot compared with the biquad. But my personal favorites are WULF's and my own Recursive Linear Phase. These are the only two possessing a linear phase response (straight GD line). This is a requirement for a perfect reconstruction of momentum.
CAUTION: Please know there is a great difference between having a good trading tool, and actually winning trades based on its signals.
And trade only with money you can spare losing. Good Luck !









Intéressant.