Candle Colors
- Indicatori
- Paulo Henrique Da Silva
- Versione: 2.10
- Aggiornato: 10 marzo 2024
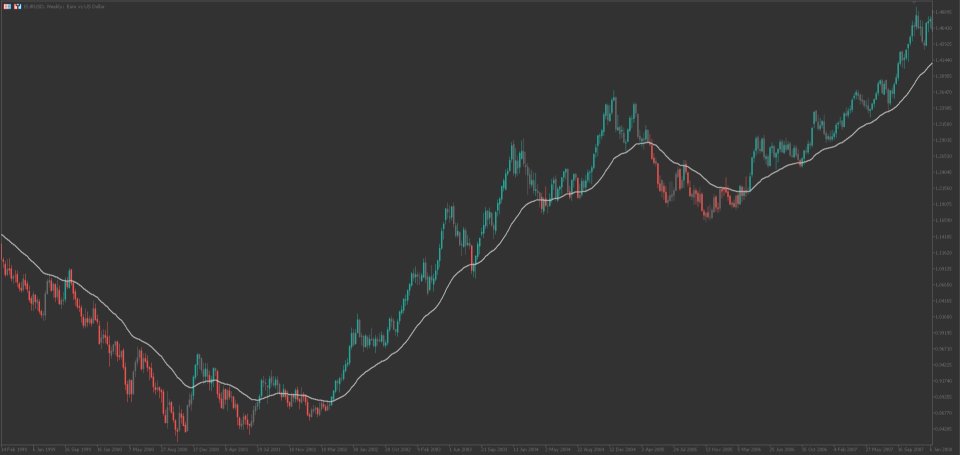
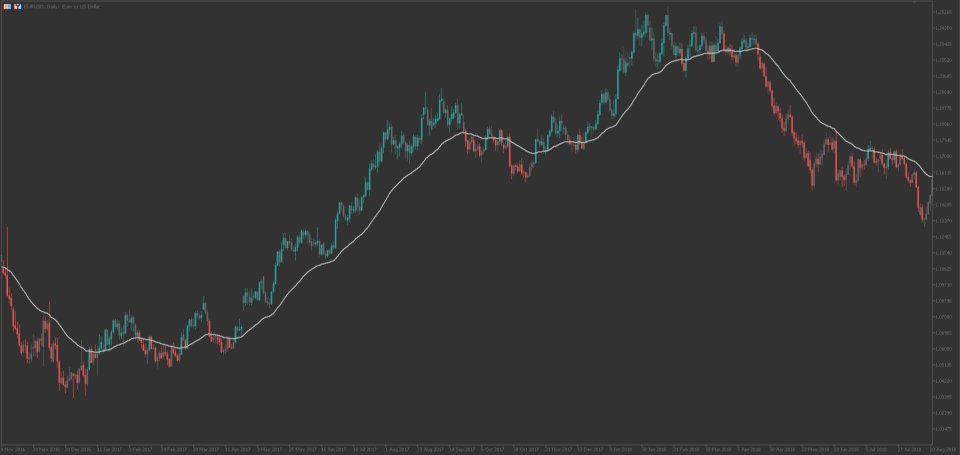
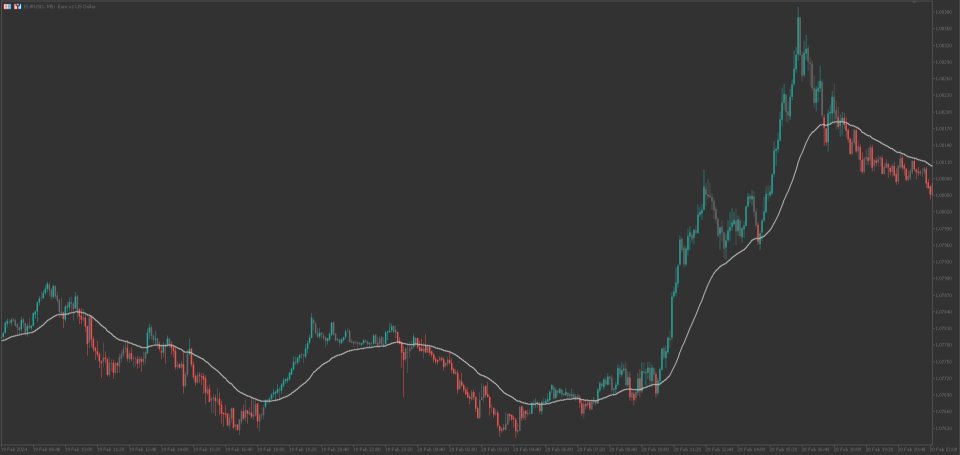
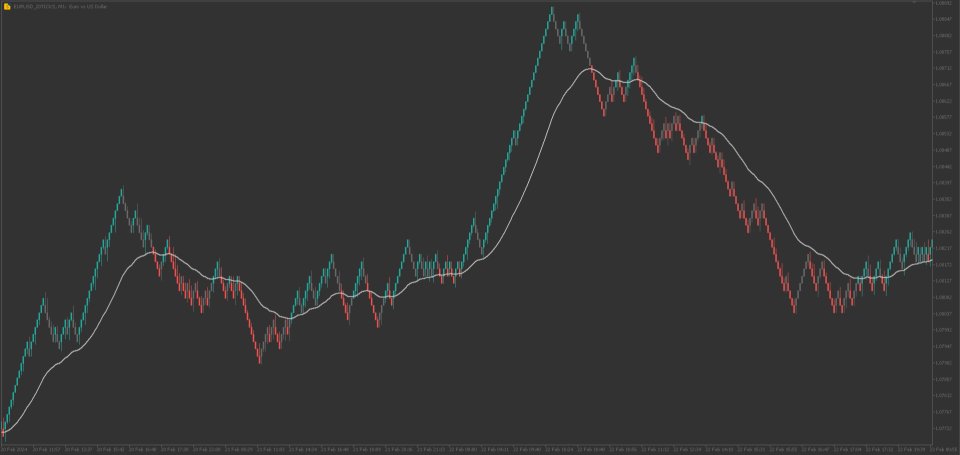
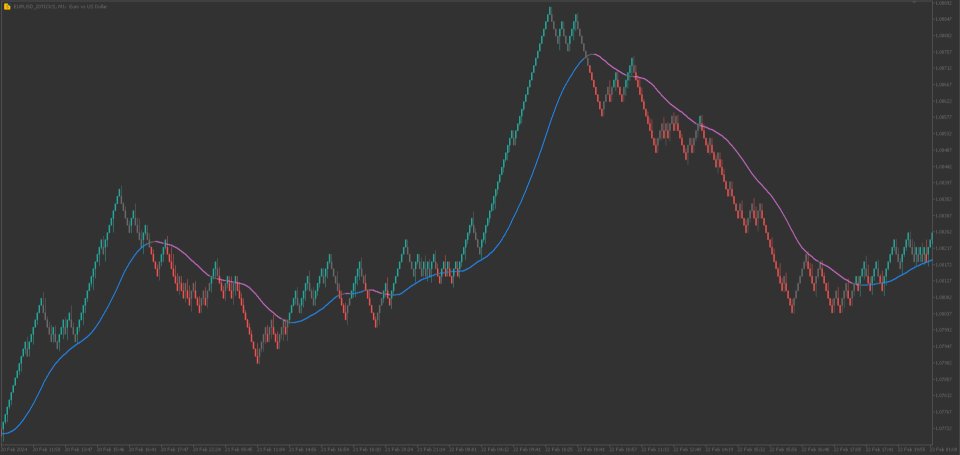
The Color Candles Indicator uses custom colors to highlight candles that follow the main market trend, based on the Moving Average. This simplifies the analysis of price movements, making it clearer and more direct.
- When the price is above the rising Moving Average, candles are highlighted indicating a BUY opportunity.
- When the price is below the declining Moving Average, candles are highlighted indicating a SELL opportunity.
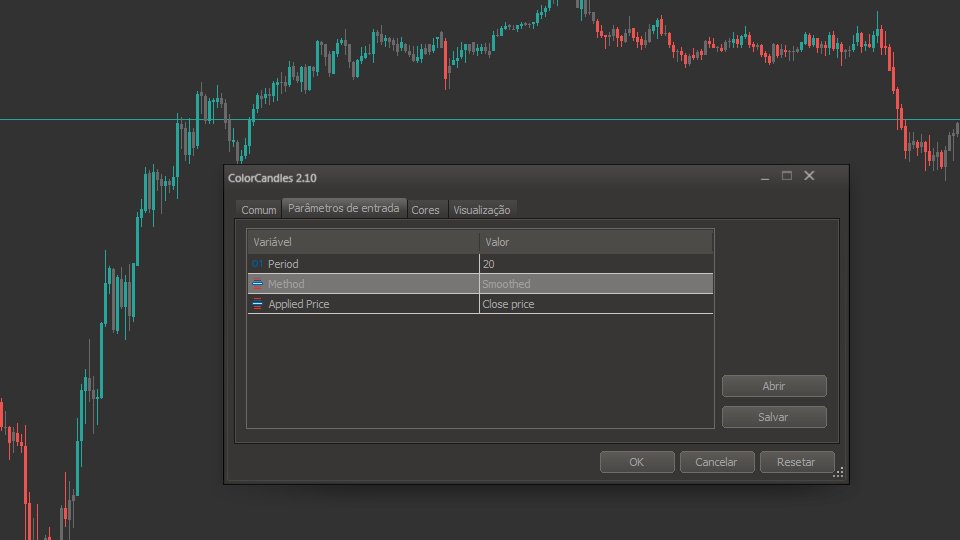
Input Parameters:
- Period
- Method
- Applied Price
The moving averages were included in the chart only to illustrate the calculation of the indicator and suggest their use together.






L'utente non ha lasciato alcun commento sulla valutazione.