Stochastic cross alert signal overlay
- Indicatori
- Nguyen Minh Tri
- Versione: 1.0
- Attivazioni: 5
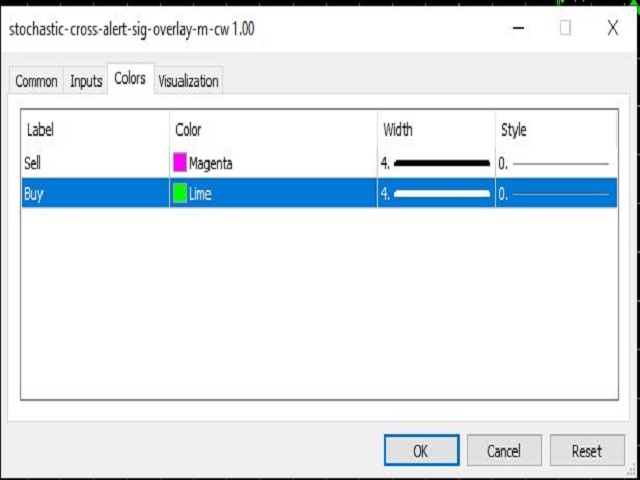
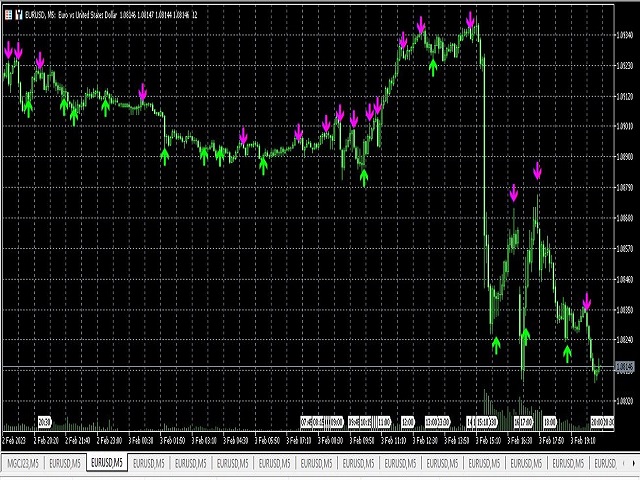
Stochastic cross alert signal overlay is indicator show signal buy and sell
you can attach it easy in your chart mt5, it work all time frame
it work all time frame
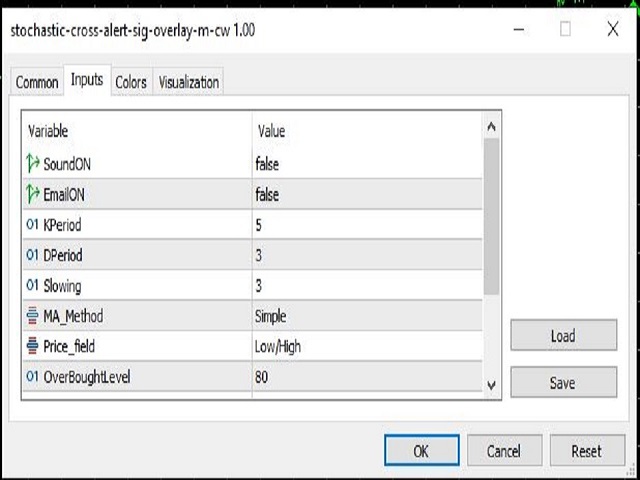
Setting:
input int KPeriod=5;
input int DPeriod=3;
input int Slowing=3;
input ENUM_MA_METHOD MA_Method=MODE_SMA;
Contact me immediately after the purchase to get the settings and a personal bonus!