Double Stochastic RSI Indicator for MT5
- Indicatori
- Loo Ming Hao
- Versione: 1.0
- Attivazioni: 10
The Double Stochastic RSI Indicator is a momentum indicator which is based on the Stochastic Oscillator and the Relative Strength Index (RSI). It is used help traders identify overbought and oversold markets as well as its potential reversal signals.
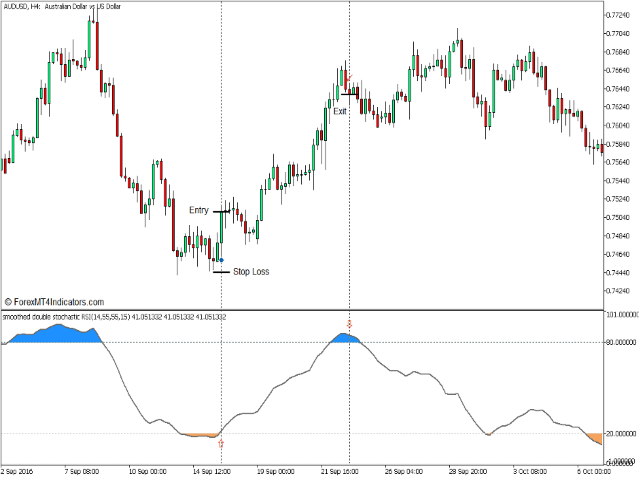
This indicator is an oscillator type of technical indicator which plots a line that oscillates within the range of zero to 100. It also has markers at levels 20 and 80 represented by a dashed line. The area below 20 represents the oversold area, while the area above 80 represents the overbought area.
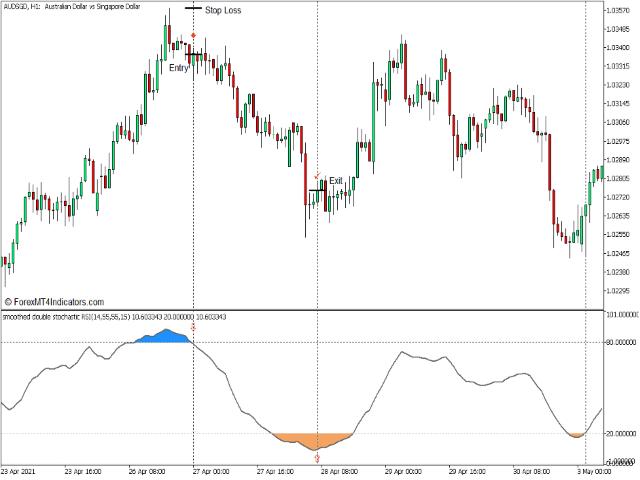
The indicator detects an oversold market whenever its line drops below 20. It then shades the area brown to indicate an oversold market level. Inversely, it also detects overbought markets whenever the line breaches above 80. It then shades the area blue to indicate an overbought market.
Given the characteristics of this indicator, it can be effectively used as a mean reversal signal indicator based on reversals coming from overbought and oversold market levels.
How the Double Stochastic RSI Indicator Works?
The Double Stochastic RSI Indicator uses a complex algorithm which uses an underlying RSI and applies a formula which is somewhat similar to that of the Stochastic Oscillator. The resulting value is then plotted as a point on the oscillator line.
The indicator also detects whether the value of the line is below 20 or above 80. It then shades the area based whenever the line value is below 20 or above 80.
How to use the Double Stochastic RSI Indicator for MT5
The Double Stochastic RSI Indicator has several variables and options which can be modified within its settings.
“RSI period” refers to the number of periods used on the underlying RSI calculation.
“RSI applied price” refers to the price point on a candlestick used to calculate for the RSI.
“Stochastic period 1”, “Stochastic period 2”, and “Smoothing period” are variables which relate to the Stochastic calculations.
“Overbought level” and “Oversold level” modifies the markers set as the overbought and oversold levels.
Buy Trade Setup
When to Enter?
Wait for the line to drop below 20 then open a buy order as the line crosses above 20.
When to Exit?
Close the trade as soon as the line starts to slope down.
Sell Trade Setup
When to Enter?
Wait for the line to breach above 80 then open a sell order as the line crosses below 80.
When to Exit?
Close the trade as soon as the line starts to slope up.
Conclusion
The Double Stochastic RSI Indicator can be a very effective mean reversal indicator. It is not perfectly accurate but its reversal signals do have a very high probability of resulting in an actual mean reversal. Its reversal signals also lean towards the mid-term trends rather than short pulses, which allows for higher potential gains on a profitable trade.
Before purchasing any EA, please conduct a backtest, as its effectiveness can fluctuate based on factors like market conditions, volatility, and different trading strategies. While some traders may find success with it, others may not experience the same results. It’s essential to take your own risks.
By purchasing this EA, you acknowledge that you have backtested it and believe that it performs effectively

