• Panoramica
  • Recensioni
  • Commenti
  • Novità

UR Gamma

UR Gamma
(alimentato da calcoli simili trovati nei sistemi di Machine Learning)

UR Gamma è uno strumento di analisi finanziaria all'avanguardia che offre una versione nuova e migliorata del classico indicatore WaveTrend. Incorporando tecniche avanzate di elaborazione del segnale digitale, UR Gamma risolve alcuni dei limiti degli algoritmi WaveTrend tradizionali e fornisce un approccio più accurato, robusto e dinamico per identificare e misurare le tendenze nell'azione dei prezzi.

Vantaggi dell'utilizzo di UR Gamma:

Installazione minimalista
Tutti i dati vengono calcolati in background - con solo 1 output per l'utente - chiaro e ordinato.
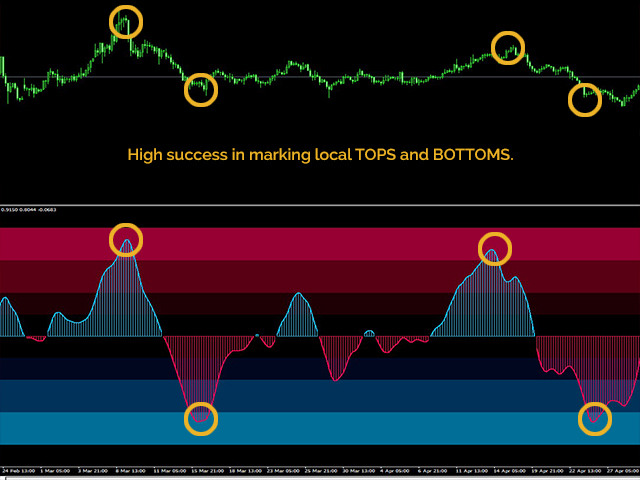
Livelli di fondo che suggeriscono esaurimento
Adattato a tutti i tipi di attività.
C'è una speciale chat di Telegram su cui puoi rimanere aggiornato sugli aggiornamenti degli strumenti e anche inviare richieste se ritieni che manchi qualcosa!


Perché UR Gamma?

L'obiettivo è far oscillare la distribuzione di probabilità tra -1 e 1, con 0 come punto centrale. Per raggiungere questo obiettivo, viene utilizzata una tecnica di Machine Learning chiamata funzione di attivazione per trasformare i dati. Una di queste funzioni è la funzione tangente iperbolica, che viene spesso utilizzata nelle reti neurali perché mantiene i valori compresi tra -1 e 1. Prendendo la prima derivata dei dati di input e normalizzandola utilizzando la media quadratica, la funzione tanh ridistribuisce efficacemente l'input segnale nell'intervallo desiderato da -1 a 1.

UR Gamma è un potente strumento per trader e investitori, che fornisce loro una visione più completa, affidabile e fruibile delle tendenze del mercato e dei movimenti dei prezzi. L'algoritmo è inoltre adattabile per l'uso su più intervalli temporali e mercati, rendendolo una soluzione versatile e flessibile per qualsiasi esigenza di analisi finanziaria. Con il suo approccio unico e le sue funzionalità avanzate, UR Gamma è uno strumento indispensabile per qualsiasi trader professionista o serio che desideri ottenere un vantaggio nei mercati finanziari.

Come usare UR Gamma?

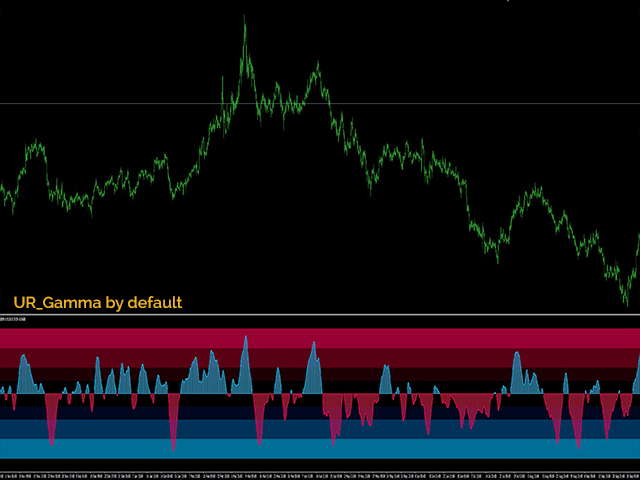
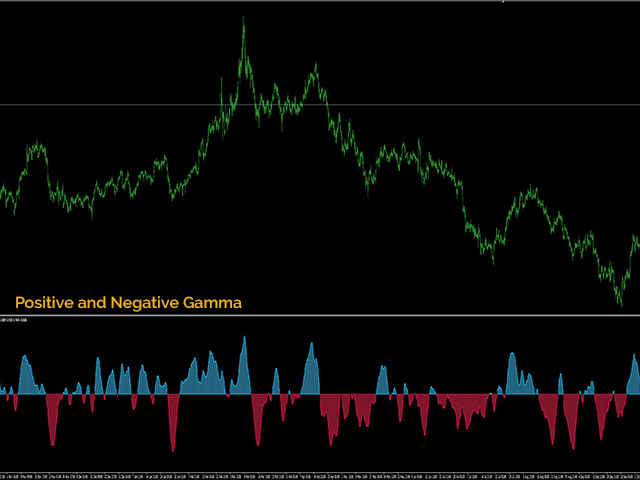
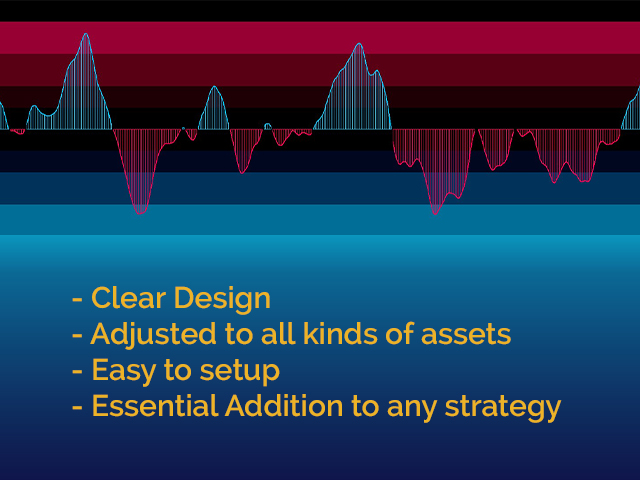
UR Gamma è un oscillatore a una linea progettato per aiutare i trader a identificare e misurare le tendenze nell'azione dei prezzi. L'oscillatore è facile da usare e fornisce una chiara rappresentazione visiva delle tendenze del mercato, con i livelli di sfondo che mostrano i possibili punti di esaurimento del prezzo. Per utilizzare UR Gamma, aggiungi semplicemente l'indicatore al tuo grafico e osserva le oscillazioni della linea. L'oscillatore oscillerà tra -1 e 1, con 0 come mediana. Quando la linea è sopra lo 0, indica che il mercato è in una tendenza al rialzo, e quando è sotto lo 0, indica una tendenza al ribasso. I livelli di fondo forniscono una chiara indicazione di possibili punti di esaurimento del prezzo, in modo che i trader possano agire di conseguenza. Per migliorare ulteriormente l'analisi, gli utenti possono regolare le impostazioni in base alle proprie preferenze e requisiti.
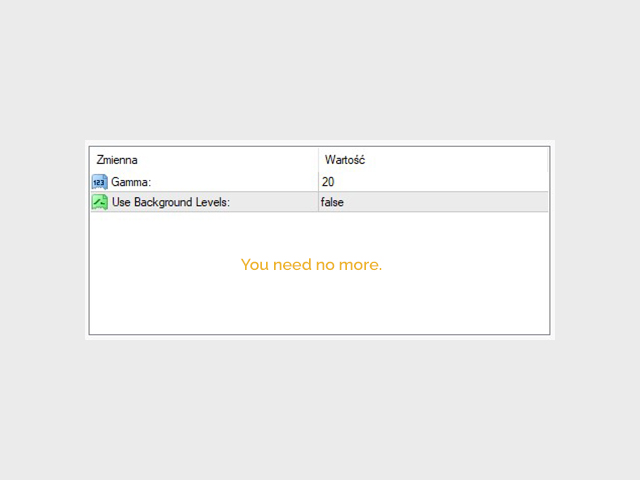

IMPOSTAZIONI
Gamma: Fondamentalmente un valore "lookback" che influenza la lunghezza delle onde - regolalo in base al periodo di tempo che stai utilizzando.
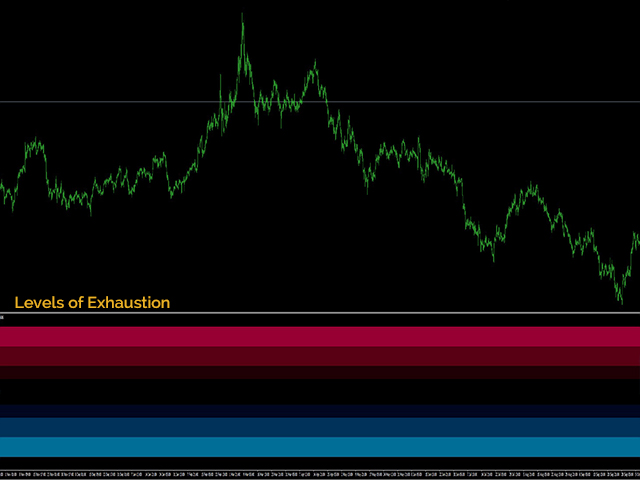
Usa livelli di sfondo: visualizzazione dell'esaurimento dietro il buffer
SCHERMO

Gamma Line: Mostra l'esaurimento del prezzo ed eventualmente i livelli di ridistribuzione che segnano massimi e minimi.
Livelli di background: mostra diversi livelli di esaurimento adattati alla configurazione predefinita.
Prodotti consigliati
Blahtech Market Profile
Blahtech Limited
4.61 (18)
Was: $249  Now: $99   Market Profile defines a number of day types that can help the trader to determine market behaviour. A key feature is the Value Area, representing the range of price action where 70% of trading took place. Understanding the Value Area can give traders valuable insight into market direction and establish the higher odds trade. It is an excellent addition to any system you may be using. Blahtech Limited presents their Market Profile indicator for the MetaTrader community. Ins
BoxChart MT4
Evgeny Shevtsov
4.57 (7)
The market is unfair if only because 10% of participants manage 90% of funds. An ordinary trader has slim changes to stand against these "vultures". This problem can be solved. You just need to be among these 10%, learn to predict their intentions and move with them. Volume is the only preemptive factor that faultlessly works on any timeframe and symbol. First, the volume appears and is accumulated, and only then the price moves. The price moves from one volume to another. Areas of volume accumu
Daily Candle Predictor è un indicatore che prevede il prezzo di chiusura di una candela. L'indicatore è destinato principalmente all'uso sui grafici D1. Questo indicatore è adatto sia per il trading forex tradizionale che per il trading di opzioni binarie. L'indicatore può essere utilizzato come sistema di trading autonomo o può fungere da aggiunta al sistema di trading esistente. Questo indicatore analizza la candela corrente, calcolando alcuni fattori di forza all'interno del corpo della cande
Infinity Trend Pro
Yaroslav Varankin
1 (1)
This is a trend indicator without redrawing Developed instead of the binary options strategy (by the color of the Martingale candlestick) Also works well in forex trading When to open trades (binary options) A signal will appear in the place with a candle signaling the current candle It is recommended to open a deal for one candle of the current timeframe M1 and M5 When a blue dot appears, open a deal up When a red dot appears, open a trade down. How to open trades on Forex. When a signal is rec
L'indicatore costruisce le quotazioni attuali, che possono essere confrontate con quelle storiche e su questa base fanno una previsione del movimento dei prezzi. L'indicatore ha un campo di testo per una rapida navigazione fino alla data desiderata. Opzioni: Simbolo - selezione del simbolo che visualizzerà l'indicatore; SymbolPeriod - selezione del periodo da cui l'indicatore prenderà i dati; IndicatorColor - colore dell'indicatore; HorisontalShift - spostamento delle virgolette d
Owl smart levels
Sergey Ermolov
4.63 (54)
Versione MT5  |  FAQ L' indicatore Owl Smart Levels   è un sistema di trading completo all'interno dell'unico indicatore che include strumenti di analisi di mercato popolari come i   frattali avanzati di Bill Williams , Valable ZigZag che costruisce   la corretta struttura a onde   del mercato, e i   livelli di Fibonacci che segnano i livelli esatti di entrata nel mercato e luoghi per prendere profitti. Descrizione dettagliata della strategia Istruzioni per lavorare con l'indicatore Consulente-
Un indicatore tecnico che calcola le sue letture sui volumi di scambio. Sotto forma di istogramma, mostra l'accumulo della forza del movimento dello strumento di trading. Dispone di sistemi di calcolo indipendenti per le direzioni rialziste e ribassiste. Funziona su qualsiasi strumento di trading e intervallo di tempo. Può integrare qualsiasi sistema di trading. L'indicatore non ridisegna i suoi valori, i segnali appaiono sulla candela corrente. È facile da usare e non carica il grafico, non r
Noize Absorption Index MT4
Ekaterina Saltykova
5 (1)
Noize Absorption Index - is the manual trading system that measures the difference of pressure between bears forces and bulls forces. Green line - is a noize free index that showing curent situation. Zero value of index shows totally choppy/flat market.Values above zero level shows how powerfull bullish wave is and values below zero measures bearish forces.Up arrow appears on bearish market when it's ready to reverse, dn arrow appears on weak bullish market, as a result of reverse expectation. S
Gold Phoenix
Yaroslav Varankin
The perfect tool for Scalng in the Forex markets You can trade both from signal to signal and using take profit  The algorithm does not use Zigzag!  No redrawing!  This is a channel instrument that uses a moving average as a filter. Moving Average  There are 2 parameters for the settings Ma Period = 5 period Moving Average  Channel 1.0 distance of channel lines from the chart Price Signal Filter - calculation of signal opening and filter There is a complete set of Alert There is a multi-timefram
Master Scalping M1 è un indicatore innovativo che utilizza un algoritmo per determinare il trend in modo rapido e preciso. L'indicatore calcola il tempo di apertura e chiusura delle posizioni, gli algoritmi dell'indicatore consentono di trovare i momenti ideali per entrare in un trade (acquistare o vendere un asset), il che aumenta il successo delle transazioni per la maggior parte dei trader. Vantaggi dell'indicatore: Facile da usare, non sovraccarica il grafico con informazioni inutili. Può es
Blahtech Supply Demand
Blahtech Limited
4.63 (35)
Was: $299  Now: $99   Supply Demand uses previous price action to identify potential imbalances between buyers and sellers. The key is to identify the better odds zones, not just the untouched ones. Blahtech Supply Demand indicator delivers functionality previously unavailable on any trading platform. This 4-in-1 indicator not only highlights the higher probability zones using a multi-criteria strength engine, but also combines it with multi-timeframe trend analysis, previously confirmed swings
Volume by Price MT4
Brian Collard
4.71 (14)
The Volume by Price Indicator for MetaTrader 4 features Volume Profile and Market Profile TPO (Time Price Opportunity). Volume and TPO histogram bar and line charts. Volume Footprint charts. TPO letter and block marker collapsed and split structure charts. Session filtering and grouping. Static, dynamic and flexible range segmentation and compositing methods with relative and absolute visualizations. Graphical layering, positioning and styling options to suit the user's analytic and aesthetic n
TWO PAIRS SQUARE HEDGE METER INDICATOR Try this brilliant 2 pairs square indicator It draws a square wave of the relation between your two inputs symbols when square wave indicates -1 then it is very great opportunity to SELL pair1 and BUY Pair2 when square wave indicates +1 then it is very great opportunity to BUY pair1 and SELL Pair2 the inputs are : 2 pairs of symbols         then index value : i use 20 for M30 charts ( you can try other values : 40/50 for M15 , : 30 for M30 , : 10 for H1 ,
The Chaikin Oscillator is a technical indicator developed by Marc Chaikin that combines price and volume data to measure the accumulation and distribution of a financial instrument. It aims to identify potential buying and selling opportunities in the market. The Chaikin Oscillator is calculated by subtracting a 10-day exponential moving average of the Accumulation Distribution Line (ADL) from a 3-day exponential moving average of the ADL. Here's how to use the Chaikin Oscillator indicator in tr
Trade with Gann on your side!! MASTER CIRCLE 360 CIRCLE CHART, originally created by Gann admitted that this is “The Mother of all charts”. It is one of the last studies that this great trader left for us. The numeric tab le is apparently quite simple like all the tables and is based on square numbers, the SQUARE OF 12 and is by evolution, one of the most important square numbers. Here we can find CYCLE, PRICE AND TIME thanks to angles and grades, to show past and future support and resistance.
The indicator allows you to trade binary options. The recommended time frame is М1 and the expiration time is 1,2,3 minutes. The indicator suitable for auto and manual trading. A possible signal is specified as a arrows above/under a candle. You should wait until the candle closes! Arrows are not re-painted Trade sessions: TOKYO section (Half-end) Currency pairs: USD/JPY Working time frame: M1 Expiration time: 1,2,3 minutes. The indicator also shows good results when using the martingale strateg
FREE
Cosmic Diviner X Planet
Olena Kondratenko
4 (2)
This unique multi-currency strategy simultaneously determines the strength of trends and market entry points, visualizing this using histograms on the chart. The indicator is optimally adapted for trading on the timeframes М5, М15, М30, Н1. For the convenience of users, the indicator renders the entry point (in the form of an arrow), recommended take profit levels (TP1, TP2 with text labels) and the recommended Stop Loss level. The take profit levels (TP1, TP2) are automatically calculated for
VolumeProfile
Robert Hess
3.8 (5)
Descption: The Volume Profile displays detailed informations of historical trading activities at certain price levels (Market Profile). So you can locate the areas with the best prices in the market and get an advantage about other market participants. Features: Customizable Volume Profile / Market Profile Shows the "fair" Value Area with 70% of all Volume Shows critical low volume zones Shows VPOC, VAL and VAH Points Works on all timeframes Also available for MT5 ( https://www.mql5.com/en/m
VR Calculate Martingale
Vladimir Pastushak
5 (5)
The VR Calculate Martingale indicator is a powerful order and position calculator for calculating profit or loss. With the help of the order and position calculator, a trader can calculate the average price of any forex currency, stocks or crypto currency. Now you can connect the indicator and start superimposing virtual orders on your real orders and positions. By creating additional virtual positions, you can calculate any development of the situation. The indicator has a built-in lot calculat
COG LR Osc AM
Andriy Matviyevs'kyy
The presented indicator allows you to determine potential entry points into the market and set protective orders at reasonable levels. This product can be useful for both beginners and experienced traders. The indicator is based on calculation methods proven by time and practicing traders. The indicator is calculated in two stages: At the first stage, linear regression (LR) of the selected price type is determined for a given number of chart periods. At the second stage, the obtained data is p
The Th3Eng PipFinite indicator is based on a very excellent analysis of the right trend direction with perfect custom algorithms. It show the true direction and the best point to start trading. With StopLoss point and Three Take Profit points. Also it show the right pivot of the price and small points to order to replace the dynamic support and resistance channel, Which surrounds the price. And Finally it draws a very helpful Box on the left side on the chart includes (take profits and Stop loss
Trendiness Index
Libertas LLC
5 (3)
"The trend is your friend" is one of the best known sayings in investing, because capturing large trendy price movements can be extremely profitable. However, trading with the trend is often easier said than done, because many indicators are based on price reversals not trends. These aren't very effective at identifying trendy periods, or predicting whether trends will continue. We developed the Trendiness Index to help address this problem by indicating the strength and direction of price trend
For sure, this indicator has become very popular amongst traders. Through coding this indicator will give you the most accurate levels possible for your trading analysis. We have also added in the ability for you to receive alerts when the price breaks above or below a Support or Resistance lines! HOW TO USE The red rectangles represent your resistance/supply zone. The green rectangles represent your support/demand zone.  BONUS FEATURES We coded this indicator with the ability to switch between
The indicator analyzes the change in the minimum and maximum prices of the previous bars fixing the entrance of the big players. If the change (delta) increases, a signal is displayed on the graph in the form of an arrow. At the same time, virtual trade on history is carried out. In case of a repeat of the signal, the positions are increased (refilling). Thus the lot of positions can differ. The results of virtual trading in the form of losses / losses, profitability, drawdown and transaction li
The Market Profile Indicator for MT4 displays the price levels and zones where increased trading activity happens. These zones with substantial forex trading activity provide the forex traders with the best entry levels, support, and resistance levels. Moreover, price levels indicate the best reversal zones. As a result, forex traders can identify BULLISH and BEARISH market trends and BUY and SELL entry points as well as the best reversal points. The indicator works well in all intraday timefram
The Best One Scalping Trade Panel functional manual trade panel with risk reward, auto SL by candle ( original solution), lot size calculation, one-click trading, scale in and out of trades (partial close),  Works with all symbols not just currency pairs, perfect works on DAX, NASDAQ, GOLD, ...... I earn every day during live stream on ZakopiecFX - join Me Risk by lot Risk by percent SL by points SL by Candle, Renko, RangeBar ( original solution) TP by point TP by Risk/Reward Auto Trailing b
This is the FXTraderariel-TakeProfit - Stop Loss Indicator . It provides you 3 potential Take Profits and 1 Stop Loss. These potential targets are computed based on several methods . The indicator can be used on every time frame, but we advise to use it on H1, H4 and D1. Especially if you are a novice trader. Pro Traders can also you use it for scalping in smaller time frames (M1, M5 and M15). This indicator is not a complete trading system. It doesn't provide you a Signal nor can predict the m
We present you the indicator "Candle closing counter", which will become your indispensable assistant in the world of trading. That’s why knowing when the candle will close can help: If you like to trade using candle patterns, you will know when the candle will be closed. This indicator will allow you to check if a known pattern has formed and if there is a possibility of trading. The indicator will help you to prepare for market opening and market closure. You can set a timer to create a p
Point61 Indicator
Evgeniy Machok
5 (1)
The Point61 indicator is the result of many years of monitoring of price behavior of currency pairs and metals. It is not a secret, that in times of uncertainty, traders are looking for possible levels of support and resistance - the point, where price should stop its movement. There are 2 possible scenarios at these points: 1. Reverse (correction) to the opposite direction; 2. Breakthrough to continue movement. Very often these points are used to set stop orders - TakeProfit or
This is a new strategy for SUPPLY DEMAND areas It is based on a calculation using the tick volume to detect the big price action in market for both bear /bull actions this smart volume action candles are used to determine the supply and demand areas prices in between main supply and demand lines indicate sideway market  up arrows will be shown when prices moves above the main supply and the secondary supply lines Down arrows will be shown when prices moves below the main demand and the secondary
Gli utenti di questo prodotto hanno anche acquistato
TPSpro RFI Levels
Roman Podpora
4.85 (20)
Reversal First Impulse levels (RFI)    INSTRUCTIONS        RUS       -       ENG              R ecommended to use with an indicator   -   TREND PRO -  Version MT5 A key element in trading is zones or levels from which decisions to buy or sell a trading instrument are made. Despite attempts by major players to conceal their presence in the market, they inevitably leave traces. Our task was to learn how to identify these traces and interpret them correctly. Main functions: Displaying active zones
Scalper Inside PRO
Alexey Minkov
4.74 (58)
An exclusive indicator that utilizes an innovative algorithm to swiftly and accurately determine the market trend. The indicator automatically calculates opening, closing, and profit levels, providing detailed trading statistics. With these features, you can choose the most appropriate trading instrument for the current market conditions. Additionally, you can easily integrate your own arrow indicators into Scalper Inside Pro to quickly evaluate their statistics and profitability. Scalper Inside
Atomic Analyst
Issam Kassas
5 (3)
Innanzitutto, vale la pena sottolineare che questo indicatore di trading non è repaint, non è ridisegno e non presenta ritardi, il che lo rende ideale sia per il trading manuale che per quello automatico. Manuale utente: impostazioni, input e strategia. L'Analista Atomico è un indicatore di azione del prezzo PA che utilizza la forza e il momentum del prezzo per trovare un miglior vantaggio sul mercato. Dotato di filtri avanzati che aiutano a rimuovere rumori e segnali falsi, e aumentare il pote
TPSproTREND PrO
Roman Podpora
4.78 (18)
TPSpro TRENDPRO  - is a trend indicator that automatically analyzes the market and provides information about the trend and each of its changes, as well as giving signals for entering trades without redrawing! The indicator uses each candle, analyzing them separately. referring to different impulses - up or down impulse. Exact entry points into transactions for currencies, crypto, metals, stocks, indices!  -  Version MT5               DETAILED DESCRIPTION                R ecommended to use with
Attualmente 20% di sconto! La soluzione migliore per ogni principiante o trader esperto! Questo software per cruscotti funziona su 28 coppie di valute. Si basa su 2 dei nostri indicatori principali (Advanced Currency Strength 28 e Advanced Currency Impulse). Offre un'ottima panoramica dell'intero mercato Forex. Mostra i valori di forza delle valute avanzate, la velocità di movimento delle valute e i segnali per 28 coppie Forex in tutti i (9) timeframe. Immaginate come migliorerà il vostro t
TrendMaestro
Stefano Frisetti
5 (3)
nota: questo indicatore e' per METATRADER4, se vuoi la versione per  METATRADER5 questo e' il link:  https://www.mql5.com/it/market/product/108123 TRENDMAESTRO ver 2.4 TRENDMAESTRO riconosce un nuovo TREND sul nascere, non sbaglia mai. La sicurezza di identificare un nuovo TREND non ha prezzo. DESCRIZIONE TRENDMAESTRO identifica un nuovo TREND sul nascere, questo indicatore prende in esame la volatilita' i volumi ed il momentum per identificare il momento in cui c'e' un'esplosione di uno 
FX Volume
Daniel Stein
4.6 (35)
Ricevi il tuo aggiornamento quotidiano sul mercato con dettagli e schermate tramite il nostro Morning Briefing qui su mql5 e su Telegram ! FX Volume è il PRIMO e UNICO indicatore di volume che fornisce una visione REALE del sentiment del mercato dal punto di vista del broker. Fornisce informazioni straordinarie su come gli operatori di mercato istituzionali, come i broker, sono posizionati sul mercato Forex, molto più velocemente dei rapporti COT. Vedere queste informazioni direttamente sul vo
Enigmera
Ivan Stefanov
5 (3)
ENIGMERA: Il cuore del mercato https://www.enigmera.com Introduzione Questo indicatore e sistema di trading rappresenta un approccio straordinario ai mercati finanziari. ENIGMERA utilizza i cicli frattali per calcolare con precisione i livelli di supporto e resistenza. Mostra l'autentica fase di accumulazione e fornisce direzione e obiettivi.  Un sistema che funziona sia in un trend che in una correzione.  Come funziona? ENIGMERA è composto da tre linee: la linea di supporto/resistenza, la
Quantum Breakout Indicator PRO
Bogdan Ion Puscasu
4.96 (26)
Presentazione       Quantum Breakout PRO   , l'innovativo indicatore MQL5 che sta trasformando il modo in cui scambi le zone di breakout! Sviluppato da un team di trader esperti con un'esperienza di trading di oltre 13 anni,   Quantum Breakout PRO   è progettato per spingere il tuo viaggio di trading a nuovi livelli con la sua strategia innovativa e dinamica della zona di breakout. Quantum Breakout Indicator ti fornirà frecce di segnalazione sulle zone di breakout con 5 zone target di prof
norepaint buy sell indicator is norepaint indicator.and works all pairs and all timeframes. using is wery simple ,it puts arrow on price probably buy sell arrows. thise indicator is suitable for beginner and experienced traders. there is cnt numbers that show how many bars you see the signal back. increasing it possible but up to chart have the how many bars . minimum value of this 500.
Gann Signal
Kirill Borovskii
Gann Signal is a very simple indicator at first glance, but hidden inside is many years of experience in studying W.D.Ganna methods. The indicator gives accurate BUY/SELL signals, without redrawing. The indicator is very easy to use. All you need to do is attach it to your chart and follow its recommendations. The indicator constantly analyzes the market for entry opportunities. When such an opportunity appears, the indicator gives a signal in the form of an arrow. I repeat, all signals are NOT
Cycle Sniper
Elmira Memish
4.39 (36)
NEW YEAR SALE PRICE FOR LIMITED TIME!!! Please contact us after your purchase and we will send you the complimentary indicators to complete the system Cycle Sniper is not a holy grail but when you use it in a system which is explained in the videos, you will feel the difference. If you are not willing to focus on the charts designed with Cycle Sniper and other free tools we provide, we recommend not buying this indicator. We recommend watching the videos about the indiactor and system before pu
Presentazione       Quantum Trend Sniper Indicator   , l'innovativo indicatore MQL5 che sta trasformando il modo in cui identifichi e scambi le inversioni di tendenza! Sviluppato da un team di trader esperti con un'esperienza di trading di oltre 13 anni,       Indicatore Quantum Trend Sniper       è progettato per spingere il tuo viaggio di trading verso nuove vette con il suo modo innovativo di identificare le inversioni di tendenza con una precisione estremamente elevata. *** Acquista Quant
Currency Strength Exotics
Bernhard Schweigert
4.88 (33)
ATTUALMENTE SCONTATO DEL 20%! La soluzione migliore per qualsiasi principiante o trader esperto! Questo indicatore è specializzato nel mostrare la forza della valuta per qualsiasi simbolo come coppie esotiche, materie prime, indici o futures. È il primo nel suo genere, qualsiasi simbolo può essere aggiunto alla nona riga per mostrare la vera forza della valuta di Oro, Argento, Petrolio, DAX, US30, MXN, TRY, CNH ecc. Si tratta di uno strumento di trading unico, di alta qualità e conveniente
Up down v6T
Guner Koca
5 (1)
Thise indicator is up down v6  comes with tradingwiev pinescript. purchased people, after installed on terminal ,contact me on mql5  to get BONUS  TradingView pinescript. up-down indicator is no repaint and works all pairs and lower than weekly time frames charts. it is suitable also 1 m charts for all pairs. and hold long way to signal. dont gives too many signals. when red histogram cross trigger line that is up signal.and price probably will down when blue histogram cross trigger line that
Entry Points Pro
Yury Orlov
4.7 (226)
Indicatore top per MT5 che fornisce segnali accurati per entrare in un trade senza riverniciare! Può essere applicato a qualsiasi attività finanziaria: forex, criptovalute, metalli, azioni, indici.  La versione MT5 è qui Fornirà segnali di trading piuttosto precisi e ti dirà quando è meglio aprire un trade e chiuderlo. Guarda il video (6:22) con un esempio di elaborazione di un solo segnale che ha ripagato l'indicatore! La maggior parte dei trader migliora i propri risultati di trading
Gold Channel is a volatility-based indicator, developed with a specific timing algorithm for the XAUUSD pair, which consists of finding possible corrections in the market. This indicator shows two outer lines, an inner line (retracement line) and an arrow sign, where the theory of the channel is to help identify overbought and oversold conditions in the market. The market price will generally fall between the boundaries of the channel. If prices touch or move outside the channel it is a tra
The AT Forex Indicator MT4 is a sophisticated trading tool designed to provide traders with a comprehensive analysis of multiple currency pairs. This   powerful indicator   simplifies the complex nature of the forex market, making it accessible for both novice and experienced traders. AT Forex Indicator uses   advanced algorithms   to detect trends, patterns and is an essential tool for traders aiming to enhance their forex trading performance. With its robust features, ease of use, and reliabl
Introduction to Fractal Pattern Scanner Fractal Indicator refers to the technical indicator that makes use of the fractal geometry found in the financial market. Fractal Pattern Scanner is the advanced Fractal Indicator that brings the latest trading technology after the extensive research and development work in the fractal geometry in the financial market. The most important feature in Fractal Pattern Scanner is the ability to measure the turning point probability as well as the trend probabi
GOLD Impulse with Alert
Bernhard Schweigert
4.56 (9)
Questo indicatore è una super combinazione dei nostri 2 prodotti Advanced Currency IMPULSE with ALERT  +   Currency Strength Exotics . Funziona per tutti i time frame e mostra graficamente l'impulso di forza o debolezza per le 8 valute principali più un simbolo! Questo indicatore è specializzato nel mostrare l'accelerazione della forza delle valute per qualsiasi simbolo come oro, coppie esotiche, materie prime, indici o futures. Primo nel suo genere, qualsiasi simbolo può essere aggiunto
System Trend Pro
Aleksandr Makarov
System Trend Pro - This is the best trend trading indicator!!! The indicator no repaint!!!   The indicator has   MTF   mode, which adds confidence to trading on the trend (   no repaint   ). How to trade? Everything is very simple, we wait for the first signal (big arrow), then wait for the second signal (small arrow) and enter the market in the direction of the arrow. (See screens 1 and 2.) Exit on the opposite signal or take 20-30 pips, close half of it, and keep the rest until the oppo
ON Trade Optuma Astro
Abdullah Alrai
5 (4)
Presentazione dell'Indicatore Astronomico per MT4: Il tuo compagno di trading celeste definitivo Sei pronto a elevare la tua esperienza di trading a livelli celesti? Non cercare oltre, il nostro rivoluzionario Indicatore Astronomico per MT4 è qui. Questo strumento innovativo va oltre gli indicatori di trading tradizionali, sfruttando algoritmi complessi per offrirti intuizioni astronomiche senza pari e calcoli di precisione. Un universo di informazioni a portata di mano: Ammira un pannello compl
Ace Supply Demand Zone Indicator The concept of supply demand relies on the quantity mismatching between buying and selling volumes in the financial market. Supply and demand zone can provide the good entry and exit. A zone is easier to trade than a line. The supply demand zone can provide the detailed trading plan and the risk management. Its ability to predict market direction is high. There are two distinctive points about Ace Supply Demand Zone Indicator. Ace Supply Demand Zone indicator was
Volatility Trend System - un sistema di trading che fornisce segnali per le voci. Il sistema di volatilità fornisce segnali lineari e puntuali nella direzione del trend, nonché segnali per uscirne, senza ridisegnare e ritardi. L'indicatore di tendenza monitora la direzione della tendenza a medio termine, mostra la direzione e il suo cambiamento. L'indicatore di segnale si basa sui cambiamenti della volatilità e mostra gli ingressi nel mercato. L'indicatore è dotato di diversi tipi di avvisi.
NAM Order Blocks
NAM TECH GROUP, CORP.
5 (1)
MT4 Multi-timeframe Order Blocks detection indicator. Features - Fully customizable on chart control panel, provides complete interaction. - Hide and show control panel wherever you want. - Detect OBs on multiple timeframes. - Select OBs quantity to display. - Different OBs user interface. - Different filters on OBs. - OB proximity alert. - ADR High and Low lines. - Notification service (Screen alerts | Push notifications). Summary Order block is a market behavior that indicates order collection
Indicator : RealValueIndicator Description : RealValueIndicator is a powerful tool designed specifically for trading on the EURUSD pair. This indicator analyzes all EUR and USD pairs, calculates their real currency strength values, and displays them as a single realistic value to give you a head start on price. This indicator will tell you moves before they happen if you use it right. RealValueIndicator allows you to get a quick and accurate overview of the EURUSD currency pair tops and bottoms,
Introduction to Fibonacci Volatility Indicator Volatility indicator can help you to detect any statistical advantage for your trading. Especially, if you are trading with Price Action and Price Patterns, then we recommend to use the Volatility indicator together with your strategy. Especically, Fibonacci Volatility indicator combines the market volatiltiy with Fibonacci Analysis to provide you more advanced volatiltiy indicator. Main Features Fibonacci Volatility in Z score Configuration Mode Fi
Please send me Direct message on MQL5 CHAT after purchasing the Indicator for Training and Installation Support There are some additional files that is important to use with the Indicator . So be sure to contact me after purchasing the Indicator So that I can add you for training and support . If you find any difficulty with installation then send me Direct message here So that I can connect with you via Anydesk or Teamview for the product installation. " Smart Order Block Indicator " to find
How to use Pair Trading Station Pair Trading Station is recommended for H1 time frame and you can use it for any currency pairs. To generate buy and sell signal, follow few steps below to apply Pair Trading Station to your MetaTrader terminal. When you load Pair Trading Station on your chart, Pair Trading station will assess available historical data in your MetaTrader platforms for each currency pair. On your chart, the amount of historical data available will be displayed for each currency pai
L'indicatore " ZigZag on Trend " è un assistente nel determinare la direzione del movimento dei prezzi, nonché un calcolatore di barre e pip. È costituito da un indicatore di trend che monitora la direzione del prezzo con una linea di trend presentata sotto forma di zigzag e da un contatore che calcola il numero di barre passate nella direzione del trend e il numero di punti su una scala verticale. (I calcoli vengono effettuati dall'apertura della barra) L'indicatore non viene ridisegnato. Per c
Altri dall’autore
UR Basket MT5
Krzysztof Jan Debski
Cestino UR   Il meglio che puoi fare è proteggere i tuoi ordini dal trasformarsi in perdite. Ora puoi rilassarti e lasciare che UR Basket se ne occupi. Vantaggi dell'utilizzo di UR Basket: Tutti i parametri sono modificabili dinamicamente nel pannello grafico del grafico - NON è necessario riavviare l'EA per modificare i parametri o richiamare le impostazioni utilizzate! Puoi monitorare i tuoi ordini tramite:   - Numero magico   - Commento EA   - Entrambi i precedenti   - Tutte le tue ope
UR TradeManager MT5
Krzysztof Jan Debski
UR_TradeManager per MetaTrader 5 Massimizza il tuo potenziale di trading con UR_TradeManager, lo strumento definitivo per migliorare il trading, progettato specificamente per la piattaforma MetaTrader 4. Realizzato con precisione e funzionalità in mente, questo strumento completo è essenziale per i trader che mirano a elevare le loro capacità di analisi di mercato, esecuzione e gestione. Caratteristiche Principali: Dashboard di Trading Visiva : Gestisci i tuoi scambi direttamente da un cruscotto
UR Control Panel
Krzysztof Jan Debski
5 (2)
Pannello di controllo dell'UR   UR Control Panel è uno strumento che voglio condividere con te GRATUITAMENTE. È un pannello interattivo che mi ha aiutato nel mio trading e ha potenziato la mia scansione del mercato ogni giorno. Spero che soddisfi anche le tue esigenze! Come utilizzare il Pannello di controllo UR? È un doppio pannello mobile e ridimensionabile di cui: - Uno di questi mostra la forza della valuta nel periodo di tempo specificato - L'altro consente alle opzioni di spostarsi
FREE
UR Basket
Krzysztof Jan Debski
Cestino UR   Il meglio che puoi fare è proteggere i tuoi ordini dal trasformarsi in perdite. Ora puoi rilassarti e lasciare che UR Basket se ne occupi. Vantaggi dell'utilizzo di UR Basket: Tutti i parametri sono modificabili dinamicamente nel pannello grafico del grafico - NON è necessario riavviare l'EA per modificare i parametri o richiamare le impostazioni utilizzate! Puoi monitorare i tuoi ordini tramite:   - Numero magico   - Commento EA   - Entrambi i precedenti   - Tutte le tue ope
UR DivergenceSpotter
Krzysztof Jan Debski
UR Divergence Spotter   UR DivergenceSpotter è il risultato di molti anni di esperienza e talvolta i modi più semplici sono i migliori. C'è una buona correlazione tra alcuni indicatori, ma quando non corrispondono - il prezzo cerca di "aggiustarsi" - ed è in quel momento che riceviamo un segnale con UR DivergenceSpotter. Vantaggi dell'utilizzo di UR Divergence Spotter: Nessun parametro Non ridipingere dopo che la candela è stata creata Segnala quando il segnale non è più valido (il che si
UR VolumeTrend
Krzysztof Jan Debski
UR VolumeTrend   UR VolumeTrend è l'indicatore di volume più chiaro che mostra la tendenza in corso in termini di volume. Funziona perfettamente con altri indicatori proprio come UR TrendExhaustion per segnalare massimi e minimi locali. Limitato a soli 2 parametri: più alti sono i valori, più lunghe saranno le tendenze che mostrerà. Gli estremi del gradiente mostrano possibili esaurimenti di volume per catturare una potenziale inversione. Due righe: l'andamento del volume e la media. Il mig
UR TrendExhaustion
Krzysztof Jan Debski
UR Trend Esaurimento   UR TrendExhaustion è la soluzione migliore per i trader che non vogliono avere a che fare con i valori dei parametri né con altre configurazioni: è facile e visivamente comprensibile per tutti. Vantaggi dell'utilizzo di UR TrendExhaustion: Nessun parametro Hai 3 linee che descrivono al meglio cosa sta succedendo sul grafico: Trend Exhaustion Line, Whale Money Line e Retail Money Line. L'interfaccia mostra l'esaurimento di entrambe le linee su entrambi gli estremi (a
UR HighsAndLows
Krzysztof Jan Debski
UR Massimi e minimi   UR Highs&Lows esegue un'analisi approfondita del movimento del prezzo e della sua volatilità e crea un canale all'interno del quale il prezzo si muove. Quel canale ora si muove come un oscillatore ed è ricoperto dalla deviazione del prezzo per segnalare potenziali esaurimenti e possibili inversioni. Vantaggi dell'utilizzo di UR Highs&Lows: Nessun parametro Hai 3 linee che descrivono il movimento del prezzo: la linea bianca che è una media del prezzo e le linee blu ch
UR Momenter
Krzysztof Jan Debski
UR Momento   UR Momenter calcola perfettamente il momentum del prezzo in correlazione all'esaurimento del movimento del prezzo rappresentato come oscillatore. Pertanto questo ci dà segnali molto precoci di potenziali inversioni o ritracciamenti. Questa formula è stata scoperta nel 2018 dopo lo scoppio della bolla di mercato. Vantaggi dell'utilizzo di UR Momenter: Nessun parametro Hai 2 linee che descrivono il movimento del prezzo - Linea bianca che è il Momentum del prezzo in correlazione
UR FrontEndBackEnd
Krzysztof Jan Debski
UR FrontEndBackEnd   UR FrontEndBackEnd è la mia formula preferita per trovare i livelli più accurati di supporto e resistenza. Li ho anche suddivisi in diverse categorie (linee tratteggiate, linee continue e aree) per evidenziare quanto sono forti. Tutto è memorizzato in buffer in modo che siano facilmente accessibili e implementabili all'interno di altri strumenti. Aggiunta: potrebbe essere necessario adattare lo strumento all'asset su cui è applicato: gli asset differiscono in termini di
UR Bands
Krzysztof Jan Debski
Bande UR (con una formula utilizzata nei sistemi di Machine Learning) UR Bands è un indicatore derivato attraverso una formula che incorpora la volatilità del mercato è simile in linea di principio a quelli utilizzati nei sistemi di apprendimento automatico. Questa rappresentazione matematica delle condizioni di mercato offre un'analisi precisa delle tendenze e delle dinamiche dei prezzi, tenendo conto della volatilità intrinseca dei mercati finanziari. Incorporando la volatilità come variabi
UR Vortex
Krzysztof Jan Debski
UR Vortex The Probabilistic UR Vortex Formula: An Accurate System for Predictive Market Analysis using Volatility and Standard Deviation Calculations. The   UR Vortex   indicator is a technical analysis tool that uses volatility and standard deviation calculations to predict potential tops and bottoms in a market. It measures the strength of a trend by calculating the distance between the current price and a moving average, and then standardizing this distance by dividing it by the average true
UR PulseScalp
Krzysztof Jan Debski
UR PulseScalp  Un indicatore di trading calibrato per gli scalper che cercano il massimo vantaggio nei mercati frenetici UR PulseScalp è una soluzione di trading all'avanguardia per gli scalper che cercano il massimo vantaggio nei mercati frenetici. Questo indicatore innovativo si basa su una formula scientificamente calibrata che combina la potenza di Volatilità, MoneyFlow e Relative Strength per creare un segnale altamente accurato e affidabile. Vantaggi dell'utilizzo di UR PulseScalp :
UR TradeManager
Krzysztof Jan Debski
UR_TradeManager per MetaTrader 4 Massimizza il tuo potenziale di trading con UR_TradeManager, lo strumento definitivo per migliorare il trading, progettato specificamente per la piattaforma MetaTrader 4. Realizzato con precisione e funzionalità in mente, questo strumento completo è essenziale per i trader che mirano a elevare le loro capacità di analisi di mercato, esecuzione e gestione. Caratteristiche Principali: Dashboard di Trading Visiva : Gestisci i tuoi scambi direttamente da un cruscotto
UR Divergence Spotter   UR DivergenceSpotter è il risultato di molti anni di esperienza e talvolta i modi più semplici sono i migliori. C'è una buona correlazione tra alcuni indicatori, ma quando non corrispondono - il prezzo cerca di "aggiustarsi" - ed è in quel momento che riceviamo un segnale con UR DivergenceSpotter. Vantaggi dell'utilizzo di UR Divergence Spotter: Nessun parametro Non ridipingere dopo che la candela è stata creata Segnala quando il segnale non è più valido (il che si
UR VolumeTrend MT5
Krzysztof Jan Debski
UR VolumeTrend   UR VolumeTrend è l'indicatore di volume più chiaro che mostra la tendenza in corso in termini di volume. Funziona perfettamente con altri indicatori proprio come UR TrendExhaustion per segnalare massimi e minimi locali. Limitato a soli 2 parametri: più alti sono i valori, più lunghe saranno le tendenze che mostrerà. Gli estremi del gradiente mostrano possibili esaurimenti di volume per catturare una potenziale inversione. Due righe: l'andamento del volume e la media. Il mig
UR Trend Esaurimento   UR TrendExhaustion è la soluzione migliore per i trader che non vogliono avere a che fare con i valori dei parametri né con altre configurazioni: è facile e visivamente comprensibile per tutti. Vantaggi dell'utilizzo di UR TrendExhaustion: Nessun parametro Hai 3 linee che descrivono al meglio cosa sta succedendo sul grafico: Trend Exhaustion Line, Whale Money Line e Retail Money Line. L'interfaccia mostra l'esaurimento di entrambe le linee su entrambi gli estremi (a
UR HighsAndLows MT5
Krzysztof Jan Debski
UR Massimi e minimi   UR Highs&Lows esegue un'analisi approfondita del movimento del prezzo e della sua volatilità e crea un canale all'interno del quale il prezzo si muove. Quel canale ora si muove come un oscillatore ed è ricoperto dalla deviazione del prezzo per segnalare potenziali esaurimenti e possibili inversioni. Vantaggi dell'utilizzo di UR Highs&Lows: Nessun parametro Hai 3 linee che descrivono il movimento del prezzo: la linea bianca che è una media del prezzo e le linee blu ch
UR Momenter MT5
Krzysztof Jan Debski
UR Momento   UR Momenter calcola perfettamente il momentum del prezzo in correlazione all'esaurimento del movimento del prezzo rappresentato come oscillatore. Pertanto questo ci dà segnali molto precoci di potenziali inversioni o ritracciamenti. Questa formula è stata scoperta nel 2018 dopo lo scoppio della bolla di mercato. Vantaggi dell'utilizzo di UR Momenter: Nessun parametro Hai 2 linee che descrivono il movimento del prezzo - Linea bianca che è il Momentum del prezzo in correlazione
UR FrontEndBackEnd   UR FrontEndBackEnd è la mia formula preferita per trovare i livelli più accurati di supporto e resistenza. Li ho anche suddivisi in diverse categorie (linee tratteggiate, linee continue e aree) per evidenziare quanto sono forti. Tutto è memorizzato in buffer in modo che siano facilmente accessibili e implementabili all'interno di altri strumenti. Aggiunta: potrebbe essere necessario adattare lo strumento all'asset su cui è applicato: gli asset differiscono in termini di
UR Gamma MT5
Krzysztof Jan Debski
UR Gamma (alimentato da calcoli simili trovati nei sistemi di Machine Learning) UR Gamma è uno strumento di analisi finanziaria all'avanguardia che offre una versione nuova e migliorata del classico indicatore WaveTrend. Incorporando tecniche avanzate di elaborazione del segnale digitale, UR Gamma risolve alcuni dei limiti degli algoritmi WaveTrend tradizionali e fornisce un approccio più accurato, robusto e dinamico per identificare e misurare le tendenze nell'azione dei prezzi. Vantaggi d
UR Bands MT5
Krzysztof Jan Debski
Bande UR (con una formula utilizzata nei sistemi di Machine Learning) UR Bands è un indicatore derivato attraverso una formula che incorpora la volatilità del mercato è simile in linea di principio a quelli utilizzati nei sistemi di apprendimento automatico. Questa rappresentazione matematica delle condizioni di mercato offre un'analisi precisa delle tendenze e delle dinamiche dei prezzi, tenendo conto della volatilità intrinseca dei mercati finanziari. Incorporando la volatilità come variabi
UR Vortex MT5
Krzysztof Jan Debski
UR Vortex MT5 The Probabilistic UR Vortex Formula: An Accurate System for Predictive Market Analysis using Volatility and Standard Deviation Calculations. The UR Vortex MT5 indicator is a technical analysis tool that uses volatility and standard deviation calculations to predict potential tops and bottoms in a market. It measures the strength of a trend by calculating the distance between the current price and a moving average, and then standardizing this distance by dividing it by the average
UR PulseScalp MT5
Krzysztof Jan Debski
UR PulseScalp MT5 Un indicatore di trading calibrato per gli scalper che cercano il massimo vantaggio nei mercati frenetici UR PulseScalp MT5 è una soluzione di trading all'avanguardia per gli scalper che cercano il massimo vantaggio nei mercati frenetici. Questo indicatore innovativo si basa su una formula scientificamente calibrata che combina la potenza di Volatilità, MoneyFlow e Relative Strength per creare un segnale altamente accurato e affidabile. Vantaggi dell'utilizzo di UR PulseSc
Filtro:
Nessuna recensione
Rispondi alla recensione
Versione 1.15 2024.05.15
Icon update
Versione 1.10 2024.05.15
Strategy Tester : Adapted the calculations so they could be backtested in the strategy tester.