Drift
- Indicatori
- Florian Nuebling
- Versione: 1.0
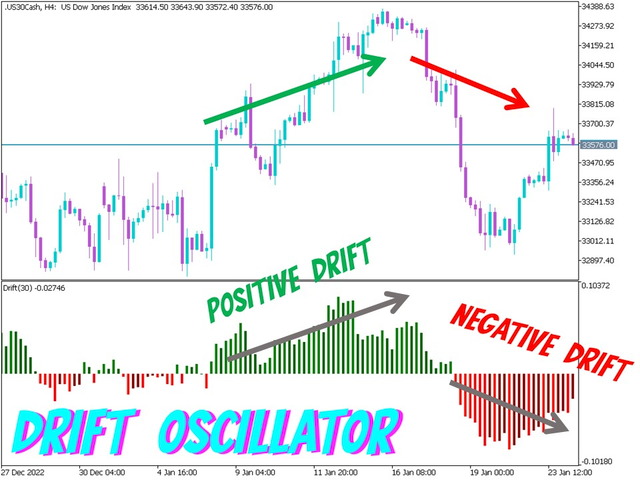
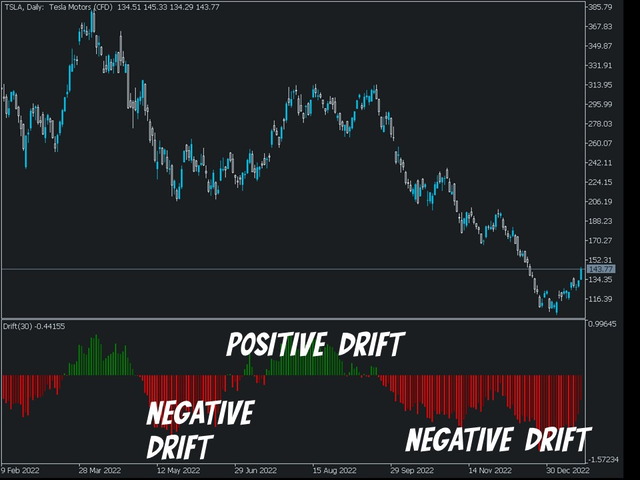
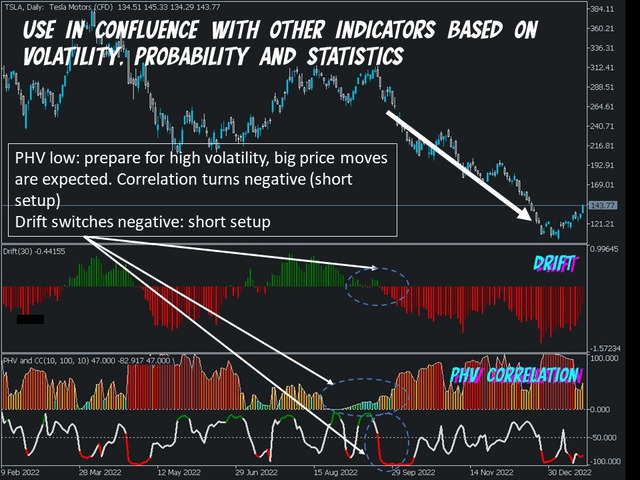
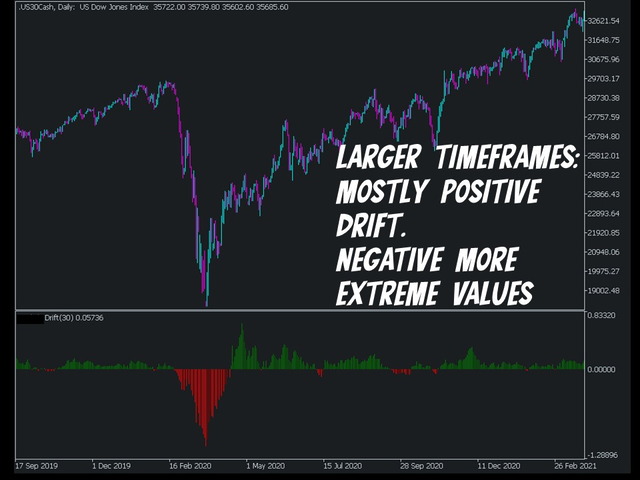
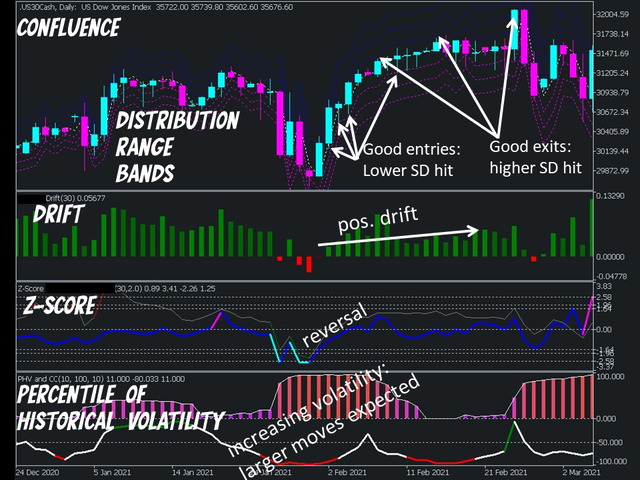
This Oscillator describes the drift of an asset, as part of the geometric Brownian Motion (GBM). As a data basis the mean reverting log returns of the asset price is considered. It gives the percentile of drift directional. For instance, a value of 0.05 means a drift of 5%, based on the selected sample size. If the value is positive, drift to higher asset values is determined.
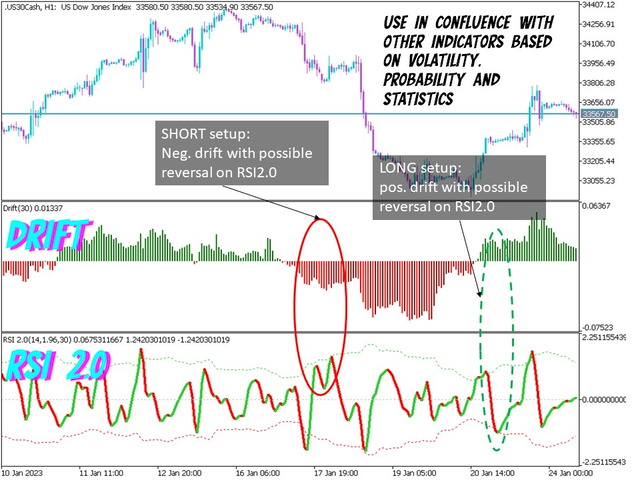
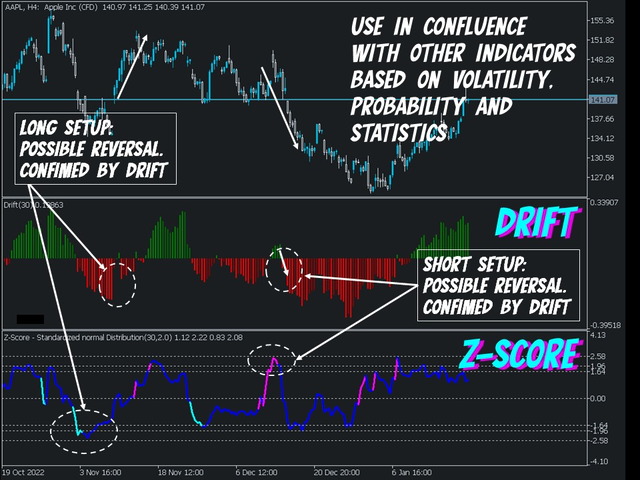
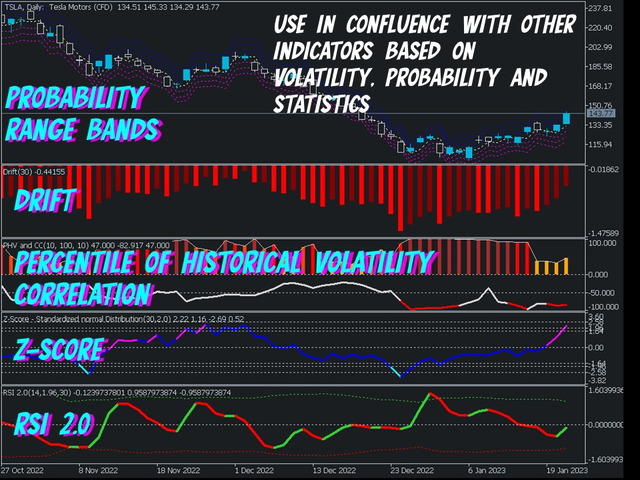
This indicator should be used in confluence with other indicators based on volatility, probability and statistics. Like the Percentile of Historical Volatility Correlation to identify potential big moves, the Z-Score to detect reversals, and the ‘Probability Range Bands’ to determine good entry and take profit points of the market.
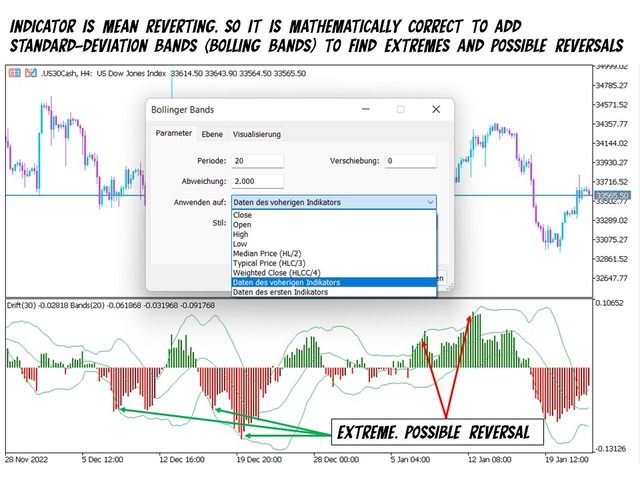
The mention indicators are based on statistical methods, probabilities and volatility. As price follows a random walk and assumed to follow a log-normal distributed, the provided concepts are based on log returns for normalization. Returns are mean reverting and can be approximated as normal distributed. The standard deviation of returns is volatility.
These concepts are different to traditional technical analysis (TA), where most calculations are based on price, like the concept of Moving Average of price or the traditional RSI oscillator. But there is no calculatable probability of a golden cross of a price based Moving Averages. But you can calculate the probabilities of the distribution of returns. Support and resistance or triangles have no statistical significance, but levels of the underlaying distribution of returns give measurable probability.
The Input Settings:
Sample Size: Default 30, length of periods back to calculate drift of price
Remark: Indicator is provided for statistical analysis and showing probabilities only and should not be construed as financial advice.

