Quick n Dirty Frequency Response
- Indicatori
- Safwan Rushdi Khalil Arekat
- Versione: 1.2
- Aggiornato: 17 febbraio 2023
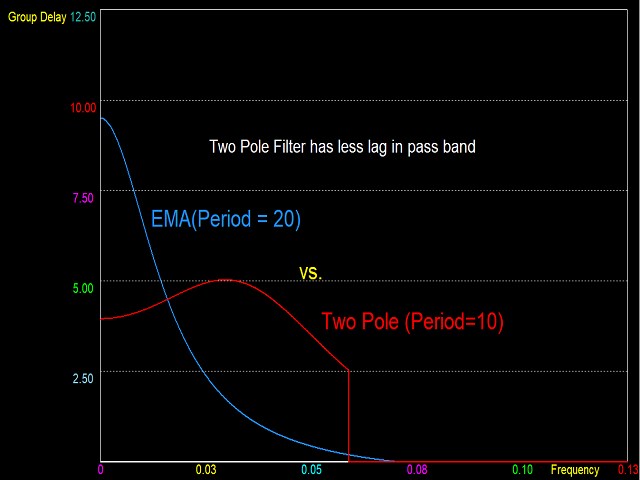
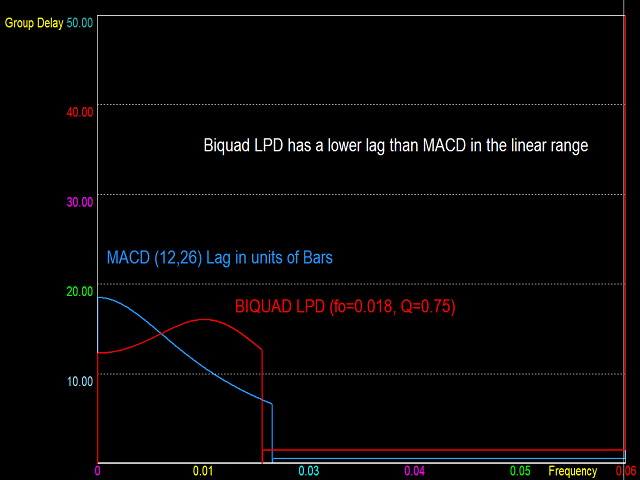
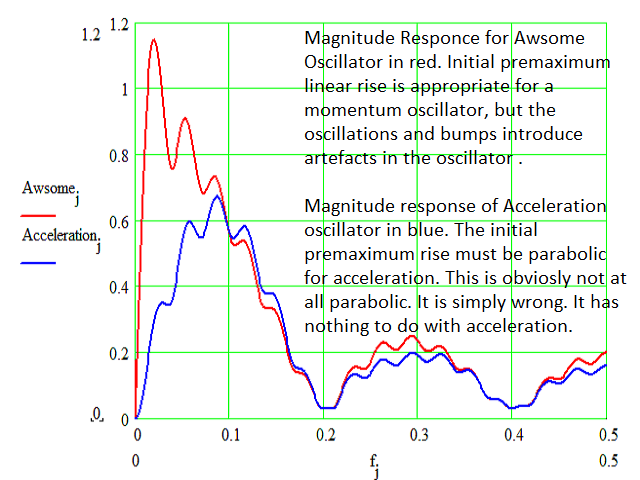
This indicator does not process the price chart data and does not provide trading signals. Instead, it is an application to compute and display the frequency response of many conventional indicators. Moving averages like the SMA, LWMA and EMA, and oscillators like the MACD, CCI, Awsome Osc, all have the form of digital filters. Electronic engineers use a special method to characterise the performance of these filters by studying their frequency response. Two important quantities of the frequency response are the magnitude and the group delay responses. The magnitude response (also called frequency spectrum) displays the ratio of the output of the filter to the input of the filter at different frequencies. The group delay is simply a fancy way of naming the lag of the output relative to the input at different frequencies (in units of number of bars). Playing with my free indicator (Price Discret Fourier Transform Toy) is a good starter to understand the concept of frequencies in a digital signal like price.
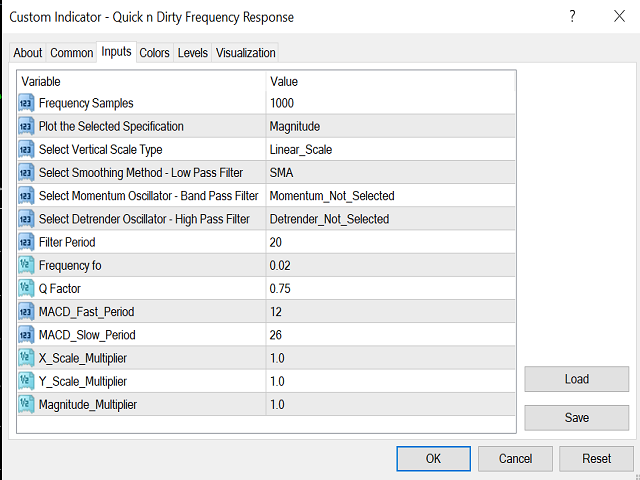
Technical indicators resembling digital filters can be classified into three types depending on their frequency characteristics. Digital filters that pass low frequencies but suppress high frequencies (Low Pass Filters, LPF) function as price smoother. They eliminate high frequency volatility and perverse the trend. The magnitude response of an LPF has a value of unity at zero frequency, or a range of low frequencies, (called pass band). These are the frequencies that are passed. Beyond the pass band, the magnitude response diminishes to very low values at high frequencies which are quenched by the filter (called stop band). A perfect filter has a very sharp transition from pass band to stop band. Among the smoother types in this indicator, the "windowed sinc" provides the best response, but a large filter period is required to do this resulting in a large lag (try setting fo=0.15 and filter period=50). Examples of indicators acting as smoothers are moving averages, and other filters introduced here, and to be presented in future indicators by this developer..
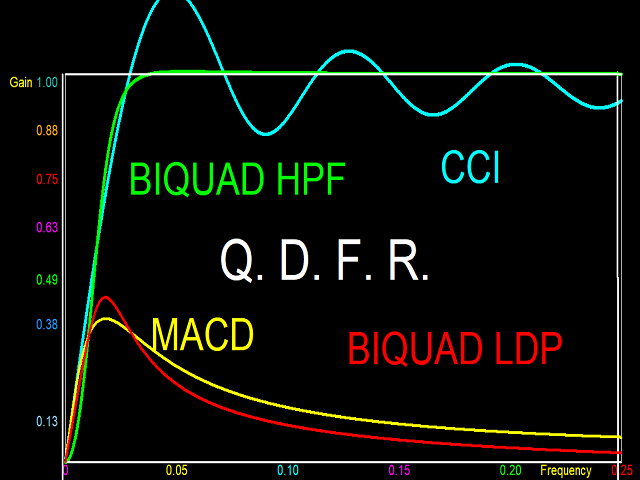
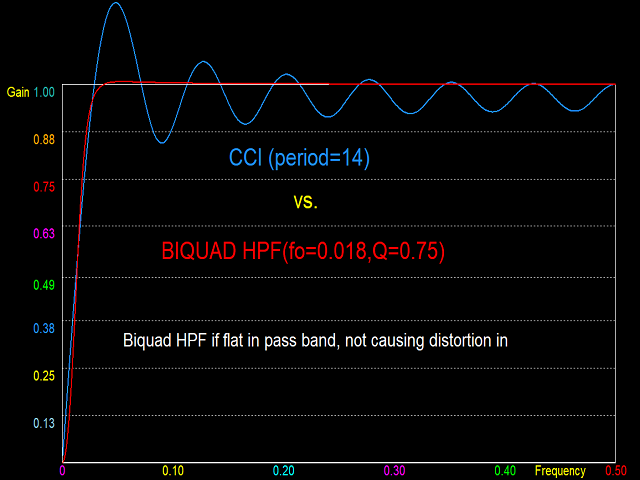
Digital filters that pass high frequencies but suppress low frequencies (High Pass Filters, HPF) function as de-trenders. They eliminate the low frequency trend and perverse the cyclic component and volatility. The magnitude response of an HPF has a value of unity at maximum frequency (0.5), or a range of high frequencies, (called pass band). These are the frequencies that are passed. Below the pass band, the magnitude response diminishes to very low values at low frequencies which are quenched by the filter (called stop band). A perfect filter has a very sharp transition from pass band to stop band. Examples of indicators acting as HPF detrenders are the CCI and the DPO , and other filters introduced here, and to be presented in future indicators by this developer.
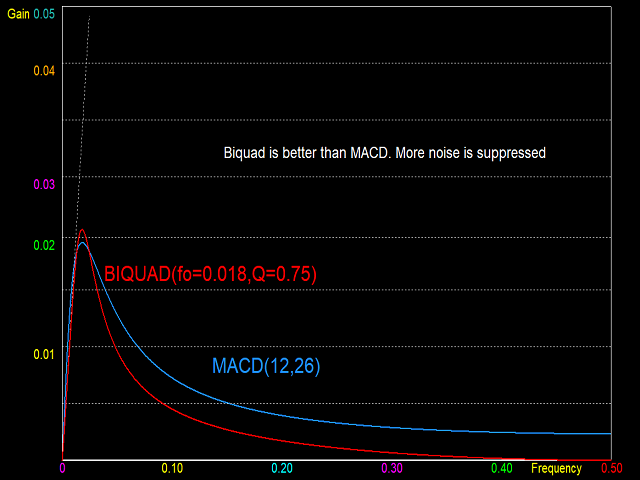
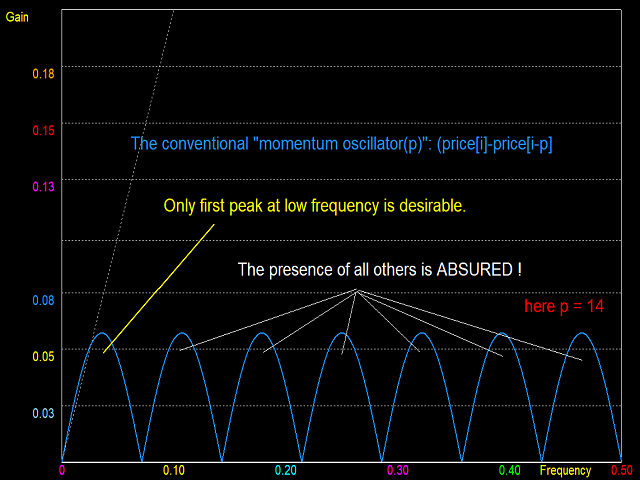
Momentum oscillators belong to the third class of digital filters called Band Pass Filters (BPF). These have two stop bands, one at low frequency and the other at high frequency, and a pass band in between. Again, a perfect BPF has sharp transitions between pass and stop bands. However, a momentum oscillator is distinguished by having a linear magnitude response in the low pass transition region. This allows the filter to act as a differentiator at low frequencies. But the transition should be sharp towards the high frequency stop band. The MACD fits closely to the requirement of a momentum oscillator. But better momentum oscillators are the Biquad Low Pass Differentiator (LPD), and the Wulf LPD. More information on these momentum oscillators will be provided in future indicators by this developer.
(This description is in progress .... more detail will be included soon)

