Scalping signal indicator
- Indicatori
- Andrey Kozak
- Versione: 1.0
- Attivazioni: 20
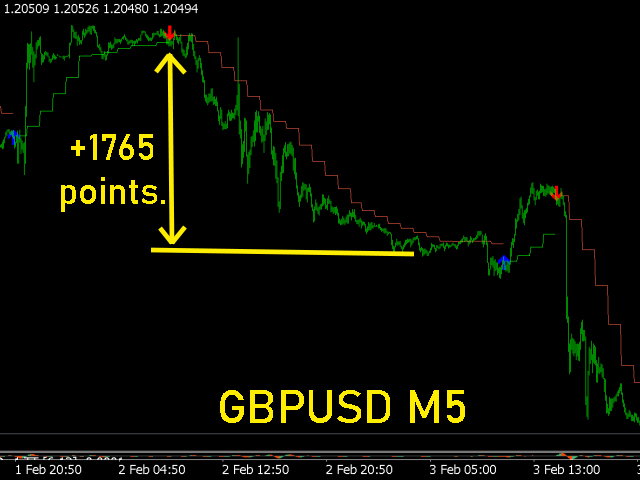
A ready-made trading strategy for scalping on the M5 period (M5 timeframe), on any currency pair. The trading strategy has been tested and has shown good performance. Every trader, even a beginner, can scalp using this strategy. To start trading, you need to open your Metatrader4 on your PC, download the "Scalping signal indicator" from this page and add it to the chart of the currency pair you want to trade. You need to select M5 timeframe (the indicator will not work on other timeframes without special optimization). After completing these procedures, you need to add the standard "Moving Average" indicator with a period of 77 to the chart. This indicator is free and it is already in your terminal, in the trend indicators folder. Now we can start trading. We will describe the trading strategy below.
Trading strategy with the "Scalping signal indicator":
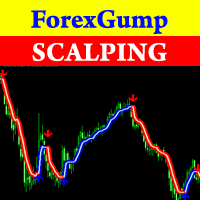
- To open buy deals: wait for the indicator to draw a green arrow. After that, we look at the "Moving Average" indicator and wait for the Open[0] price to cross the indicator from the bottom up. This will be a signal to open a buy trade. Take Profit +15 pips on GBPUSD and EURUSD. On other pairs of TakeProfit, we set from +25 to +55 points (depending on the spread size for the current pair). StopLoss set -35 points from the green line for GBPUSD and EURUSD pairs. For other pairs, set StopLoss from -35 to -90 points (depending on the spread size for the current pair).
- To open sell trades: wait for the indicator to draw a red arrow. After that, we look at the "Moving Average" indicator and wait for the price of Open[0] to cross the indicator from top to bottom. This will be a signal to open a sell trade. Take Profit -15 pips on GBPUSD and EURUSD. On other pairs of TakeProfit, we set from -25 to -55 points (depending on the spread size for the current pair). StopLoss set +35 points from the red line for GBPUSD and EURUSD pairs. For other pairs, StopLoss is set from +35 to +90 points (depending on the spread size for the current pair).
See the video below for a more detailed trading strategy. There we will show you how to trade in more detail.
Indicator settings:
- Period_of_hydrodization_of_wave_analysis - in this parameter we indicate how many subgroups a complex trend wave should be divided into to determine the price movement reversal. This parameter affects the frequency and accuracy of the signals. Simply put, the higher the value of the parameter, the less often the signals will be and they will show longer price reversals.
- display_history - this parameter tells the indicator on how many candles on the chart the signals should be displayed. But since the indicator calculates the reversal and trend movement only for the period on which it is displayed on the chart, accordingly, this parameter indirectly affects the calculation of reversal signals. In other words, this parameter affects not only the display of signals on the chart, but also the accuracy of the signals themselves.

