• Panoramica
  • Recensioni
  • Commenti (4)
  • Novità

Tillson T3 TMA

TILLSON MOVING AVERAGE

Conosciuto anche come indicatore TMA o T3. È una media mobile che utilizza EMA e DEMA nella sua formula ed è calcolata con un'espansione binomiale di 3° grado.

Professionisti;

1-      segnali errati riscontrati in altre medie mobili ( zig continuo zag ) è stato ridotto il più possibile.

2-      impedito i ritardi osservati nelle medie mobili classiche .

3-      Molto successo nelle tendenze

Contro

1-      Non è efficace nei mercati orizzontali.

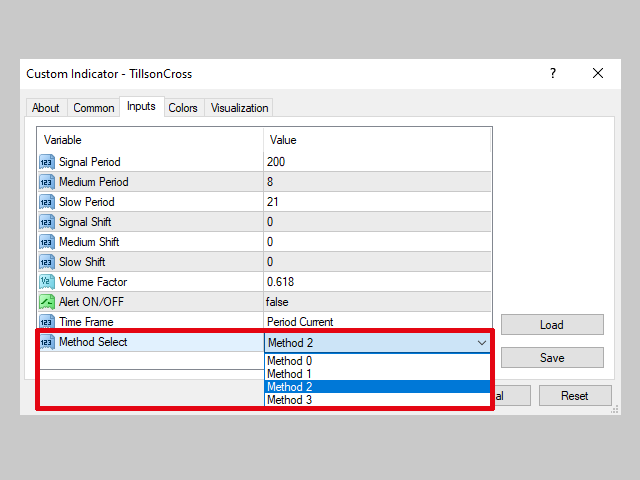
Parametri di impostazione;

period; Sebbene il valore consigliato sia 5, è possibile utilizzare anche valori di 7 o 8.

Volume Factor; L'intervallo da 0 a 1 è l'intervallo di valori consigliato, ma può arrivare fino a un massimo di 2. Il valore consigliato è 0,7 . Per spiegare più semplicemente l'effetto di Volume Factor su T3, se assume valori vicini a 0, mostrerà un comportamento simile a EMA, e se assume valori vicini a 1, mostrerà un comportamento simile a DEMA .

Segnali BUY/SELL;

Metodo 1; Una strategia che utilizza 1 x T3,

Quando Volume Factor=0.7, Periodo=8 e oltre

-          Se le barre incrociano T3 verso l'alto, BUY segnala

-          Segnalazione SELL se le sbarre si abbattono su T3

Metodo 2; Una strategia che utilizza 2 x T3,

-          periodo piccolo T3 interrompe il segnale del periodo grande T3 dal basso verso l'alto BUY

-          periodo piccolo T3 interrompe il segnale del periodo grande T3 dall'alto verso il basso SELL

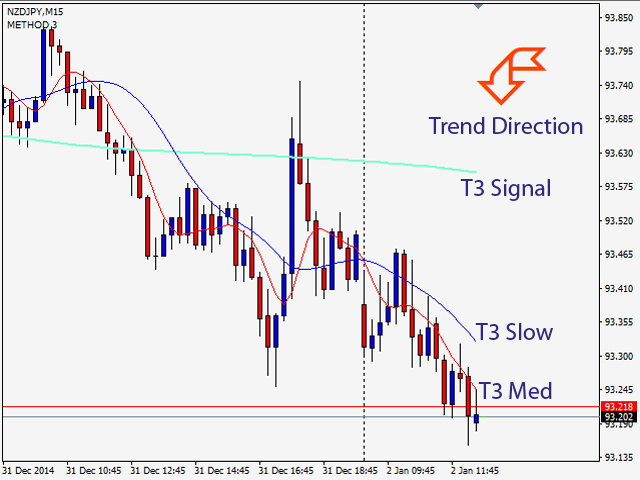
Metodo 3; Una strategia che utilizza 3 x T3,

Consiste nell'aggiungere un terzo T3 di tendenza al metodo 2. Valori standard; Periodo1=200, Periodo2=8, Periodo3=21 e Volume Factor=0.7

            T3 con periodo1=200 sarà il determinante della direzione del trend. In altre parole, quando i T3 di piccolo periodo sono superiori a T3 di 200, la tendenza sarà considerata in rialzo e solo i segnali BUY saranno considerati secondo il Metodo 2. Allo stesso modo, quando i T3 di piccolo periodo sono inferiori a T3 di 200, la tendenza sarà considerata in rialzo e solo i segnali SELL saranno considerati secondo il Metodo 2.

Indicatore Valori predefiniti;

T3Signal;         Periodo; 200   Colore; Verde chiaro

T3Med;            Periodo; 8   Colore; Rosso

T3Slow;           Periodo; 21   Colore; Blu

Prodotti consigliati
Laguerre Dots 2 AM
Andriy Matviyevs'kyy
This indicator displays the signals of a highly effective oscillator -  Laguerre Osc 2 AM   - on the price chart. The presented indicator uses the Laguerre filter to build an oscillator. The indicator has the possibility of double additional smoothing, which can be useful for small values ​​of the Gamma parameter. The indicator gives three types of signals: Exit of the oscillator from the overbought / oversold zone; The oscillator crossing the middle of the value between the overbought/oversold
FREE
This indicator is producing accurate signal based on distances between crossection     point of 571 period moving average with 632 period bollinger band and 17 moving average and 171 moving average.     You can also use this signal with expert advisor with below code      double v1= 0 ;     v1= GlobalVariableGet ( Symbol ()+ string ( Period ())+ "HSKPASHAVO1" );      if (v1== 0 )   return ( 0 ); // No Signals      if (v1== 1 )        {        //Send BUY Order...        GlobalVariableSet ( Symbo
Lampropeltis
Vladimir Blednov
4.6 (5)
Lampropeltis is a trend indicator. The algorithm of calculation is based on data from the standard indicators included in the MT4 package and interpretation of patterns formed by these indicators. The settings include a minimum set of parameters: Slow MA - slow MA period; Slow MA method - slow MA smoothing method; Fast MA - fast MA period; Fast MA method - fast MA smoothing method. Change of the signal color to red indicates the possibility of opening a Sell order. Change of the signal color to
FREE
Multi RsIBB MT4
Mansour Babasafary
4 (2)
A combined indicator of two famous indicators: RSI , Bollinger Bands Can be used in all currency pairs Can be used in all time frames with many signals Very simple and fast to use Description: This indicator is made from the combination of RSI and Bollinger Bands indicators As you can see, it shows good signals and is worth using and testing We hope you are satisfied with this indicator Settings: show past show candle: Displays the number of candles that the indicator calculates. For
FREE
This indicator idea comes from Tushar Chande called Qstick. Technical indicators quantify trend direction and strength in different ways. One way is to use the difference between close and open for each bar and to sum it up over a period of time. The formual is: Qstick (period ) = Average ((close-open ), period ) In this indicator, we can choose how to calculate body by two famous chart types. The first and default indicator settings are based on Heiken Ashi chart, and the second i
FREE
Ind Gap detector mt4
Mauricio Valbuena
5 (1)
GAP DETECTOR FVG in trading refers to "Fair Value Gap", . It is a concept used in technical analysis to identify areas on a price chart where there is a discrepancy or gap between supply and demand. These gaps can occur due to rapid movements in price, usually as a result of important news or economic events, and are usually filled later as the market stabilizes. The GAP DETECTOR indicator is designed to identify fair value gaps (FVG) on the price chart and filter them using volatility to det
FREE
Индикатор сглаженного DeMarker  Oscillator (xDeM) Входные параметры: Period - период усреднения Принцип работы Индикатор перерассчитывает стандартный технический индикатор DeMarker Oscillato r (дважды усредняет получаемые значения). Период усреднения индикатора соответствует двойному периоду стандартного DeMarker  Oscillato r . Например : xDeM с периодом усреднения 7 соответствует DeM c периодом 14. Индикаторный буфер не перерисовывается.
FREE
An improved version of the standard Standard Deviation indicator. It is now a responsive and smoothed line. The setup is not straightforward - but I hope you can do it. It is very easy to understand the readings of this indicator, the meaning is the same as that of the usual Standard Deviation. //////////////////////////////////////////////// /////////////////////////////////// I hope this indicator will be very useful to you in successful trading. Good luck.
FREE
MA Crosses Show
Faran Ataeiraveshti
5 (1)
Hello.  Another free indicator from Sepehr! ;) You can determine the trend with this tool. Using crosses of two Moving averages, you can say that the trend is going to be bullish or bearish; A fast-moving average and a slow one. When the fast-moving crosses up the slow-moving, it's going to be an uptrend and when it crosses down the slow-moving, it means that you are going to have a downtrend. That's easy ;) Hope to enjoy it Sepehr(Faran)
FREE
MACD divergence indicator finds divergences between price chart and MACD indicator and informs you with alerts (popup, mobile notification or email). Its main use is to find trend reversals in the chart. Always use the divergence indicators with other technical assets like support resistance zones, candlestick patterns and price action to have a higher possibility to find trend reversals. Three confirmation type for MACD divergences: MACD line cross zero level Price returns to previous H/L Creat
FREE
RaysFX Stochastic  L'indicatore RaysFX Stochastic è un indicatore personalizzato per la piattaforma MetaTrader 4. Caratteristiche principali: -Indicatori separati: L'indicatore viene visualizzato in una finestra separata sotto il grafico principale. -Livelli dell'indicatore: L'indicatore ha due livelli predefiniti, 20 e 80, che possono essere utilizzati come livelli di ipervenduto e ipercomprato. -Buffer dell'indicatore: L'indicatore utilizza quattro buffer per calcolare e memorizzare i suo
FREE
WPR LB bar AM
Andriy Matviyevs'kyy
The indicator identifies the strength of the trend based on the points where the WPR indicator exceeds the overbought and oversold levels. The indicator does not redraw. This indicator: Suitable for all markets;  Not redrawn; Intuitive and simple; It can be useful for both beginners and experienced traders; Allows you to identify market entry points where there is a high probability of a significant price movement sufficient for a successful transaction; Settings: Ind_Period (>1)   - period of
FREE
Shooter AM
Andriy Matviyevs'kyy
This indicator is an implementation of the "One shot - one hit" principle. In the course of work on the creation of this product, an attempt was made to achieve the maximum balance between the sensitivity of the indicator and the effectiveness of its signals. This tool is as reliable and effective as a 45 caliber revolver, but in the same way it requires discipline and understanding of the conditions and purpose of use from its user. The indicator has only one adjustable parameter that determine
FREE
Shooter 2 AM
Andriy Matviyevs'kyy
This indicator is an implementation of the "One shot - one hit" principle. In the course of work on the creation of this product, an attempt was made to achieve the maximum balance between the sensitivity of the indicator and the effectiveness of its signals. This tool is as reliable and effective as a 45 caliber revolver, but in the same way it requires discipline and understanding of the conditions and purpose of use from its user. The indicator has only one adjustable parameter that determine
FREE
Donchian channels are a tool in technical analysis used to determine the relative volatility of a market and the potential for price breakouts. Can help identify potential breakouts and reversals in price, which are the moments when traders are called on to make strategic decisions. These strategies can help you capitalize on price trends while having pre-defined entry and exit points to secure gains or limit losses. Using the Donchian channel can thus be part of a disciplined approach to manag
FREE
StarBody
Gabriele Tedeschi
5 (1)
StarBody è un indicatore istogramma che rappresenta la dimensione delle candele in relazione al loro volume ed evidenzia quelle più grandi delle precedenti. La formula per il calcolo dell'altezza dell'istogramma è semplice quanto efficace: Ampiezza * Volume La grafica indicherà tutte le candele più estese delle precedenti in base alle impostazioni scelte. L'indicatore può essere utile, a volte indispensabile, nelle strategie che prevedono lo sfruttamento della continuazione del trend. Le strat
FREE
MWC Ratio
Joerg Hamann
4 (2)
The Commitments of Traders Ratio Indicator is one of these things you never thought about it before you really see the magic behind it. The indicator shows the Ratio of long/short positions released by the CFTC once a week. If you have a look on the Sreenshot you can see two (three) zones of interest. Zone 1: The Switches (Red -> Green, Green -> Red) Zone 2: MA cross Zone 3: If you combine this with the COX indicator an additional zone will appear. You also can experiment with Ratio crossing M
FREE
The product   Divergence Cci Force Stddev Ac Atr   is designed to find the differences between indicators and price. It allows you to open orders or set trends using these differences. The indicator has 4 different divergence features. Divergence types Class A Divergence Class B Divergence Class C Divergence Hidden Divergence Product Features and Rec ommendations There are 5 indicators on the indicator Indicators =   CCI, Force, Stdandard Deviation, Acelereator, Atr 4 different divergence ty
FREE
MACD Signals Dashboard
Mihails Babuskins
4 (4)
Download directly the indicator file here. (if you can't open on MT4) MACD Indicator is one of the most popular momentum indicators among users. Searching and detecting MACD signals by the eye may not be easy. Scan Full Charts Dashboard Indicator with simple user interface and search customization panel saves time and scans all charts for MACD signals search and notifies the user with high accuracy. After finding the signal, the user was aware of the result by alerts and notifications. This ind
FREE
Ichimoku wave
Bardia Mohammadi
For all those traders interested or currently trading Ichimoku, you will not want to miss this article. Although I am heading out in a few hours with my girlfriend to Harbin Hot Springs, I wanted to write a brief introduction to   Ichimoku Number Theory   as there has been a lot of questions (and confusion) about Ichimoku settings, time frames, etc. The basis of Ichimoku as known to most is the 5 lines; Tenkan Line Kijun Line Senkou Span A (part of the Kumo) Senkou Span B (other part of the Kum
FREE
Keltner Trend Pro - Unleash the Power of Price Action! Are you ready to transform your trading approach? Meet Keltner Trend Pro, an Expert Advisor meticulously crafted to harness the dynamic movements of the market using the renowned Keltner Channel and Average True Range (ATR) indicators. Limited-time Special Opportunity: Seize the moment! Be among the first 10 (Purchasing 0/10) to seize this unique opportunity, and not only will you acquire a top-tier trading algorithm but also enjoy an exclu
FREE
Trend Based Fibo MT4
Nguyen Tuan Son
3 (1)
The most Flexible & Reliable   Trend-Based Fibonacci indicator by Safe Trading. This indicator helps you calculate Trend-Based Fibonacci levels base on the main and retracement trends to predict future price . If you just looking for a simple Fibonacci Retracement indicator, please use  this Free indicator . ### FEATURES ### Auto-calculate up to 7 Trend-Based Fibonacci levels on adjustable frame. Adjust Fibonacci levels as your need. Adjust the start and the end of calculated frame in indicato
FREE
WPR Signal AM
Andriy Matviyevs'kyy
This indicator displays the signals based on the values of the classic WPR indicator. The WPR indicator can be used for determining the overbought or oversold areas on the chart. Reaching these levels means that the market can soon turn around, but it does not give signal, as in a strong trend the market can stay in the overbought or oversold state for quite a long time. As with most oscillators, the signals are generated when leaving these areas. This indicator allows to display three types of
FREE
This semaphore indicator is based in the standard RSI, which is applied over the Envelopes indicator that shows an envelope or envelope fluctuation borders. This is a version of RSI vs Envelopes drawn in the symbol window . A sell signal emerges when the upper envelope/border is broken by the RSI indicator from top to bottom. A buy signal emerges when the lower envelope/border is broken by the RSI indicator from bottom upwards. The indicator can draw arrows on the indicator, draw vertical lines
FREE
This indicator is designed to find the difference in MOMENTUM price and indicator.  This indicator shows the price and indicator difference on the screen. The user is alerted with the alert sending feature. Our Popular Products Super Oscillator HC Cross Signal Super Cross Trend Strong Trend Super Signal Parameters divergenceDepth -  Depth of 2nd ref. point search Momentum_Period -  Second calculation period indAppliedPrice -  Applied price of indicator indMAMethod -  MA calculation method findEx
FREE
This indicator is using two moving average , signal will be crated according to preset points on two Moving Average. In general, First signal is immadiate entrence and second order is limit order. color IndLevelColor=clrYellow;  // Indicator Level Color extern int   ArrowGap=35; // Close+-Arrow Gap Pips extern int   SecondOrderEntryLevelPips=500;// Second Limit Order Entry Level Pips extern int   HareketliOrtalamaGiris1=5; // 1. Moving Average extern int   HareketliOrtalamaGiris2=35;// 2. Moving
CCI Jurik
Augustine Kamatu
Introducing CCI Jurik—a dynamic indicator designed to elevate your forex trading experience by integrating custom moving averages based on the Commodity Channel Index (CCI) with the MetaTrader 4 indicator, CCI. Jurik moving averages are renowned for their accuracy and reliability in analyzing price movements in the forex market. They offer traders a smoother representation of price action, reducing noise and providing clearer signals for identifying trends and potential reversals. The Commo
FREE
Hidden Ichimoku
Christian Ricard
This indicator allows to hide Ichimoku Kinko Hyo (on all MT4 timeframes) from a date define by the user, with a vertical line (Alone) or a panel (with "Hidden Candles"). Indicator Inputs: Tenkan-sen Kijun-sen  Senkou Span B Information on "Ichimoku Kinko Hyo" indicator is available here:   https://www.metatrader4.com/en/trading-platform/help/analytics/tech_indicators/ichimoku ************************************************************* Hey traders!!  Give me your feeds!  We are a community here
FREE
Bar Size Oscillator
Alexandr Gladkiy
2 (1)
Индикатор отображает размер бара и его направление. ---------------------------------------- Цвета гистограммы: * Красный - Медвежий бар. * Зелёный - Бычий бар. * Серый - Цена открытия и цена закрытия равны. * Синяя линия - скользящая средняя. ---------------------------------------- Параметры: - Type of Calculation - Тип расчёта ( Low to High, Open to Close ) - Moving Avarage - Период скользящей средней
FREE
DF Osc AM
Andriy Matviyevs'kyy
DF Osc AM - this is an indicator that marks the moments when the price direction changes.  The indicator uses adaptive digital filters for analysis. Digital filters are (simplified) a way to smooth data. Unlike traditional moving averages, a digital filter will be more effective in most cases. The indicator does not redraw, the signal is generated after the candle is completed. It is optimal to use the indicator signals as signals to open a trade when the price overcomes the maximum or minimum o
FREE
Gli utenti di questo prodotto hanno anche acquistato
Gann Made Easy
Oleg Rodin
4.93 (70)
Gann Made Easy è un sistema di trading Forex professionale e facile da usare che si basa sui migliori principi del trading utilizzando la teoria di mr. WD Gann. L'indicatore fornisce segnali ACQUISTA e VENDI accurati, inclusi i livelli di Stop Loss e Take Profit. Puoi fare trading anche in movimento utilizzando le notifiche PUSH. Vi prego di contattarmi dopo l'acquisto! Condividerò i miei consigli di trading con te e fantastici indicatori bonus gratuitamente! Probabilmente hai già sentito parlar
Atomic Analyst
Issam Kassas
5 (3)
Innanzitutto, vale la pena sottolineare che questo indicatore di trading non è repaint, non è ridisegno e non presenta ritardi, il che lo rende ideale sia per il trading manuale che per quello automatico. Manuale utente: impostazioni, input e strategia. L'Analista Atomico è un indicatore di azione del prezzo PA che utilizza la forza e il momentum del prezzo per trovare un miglior vantaggio sul mercato. Dotato di filtri avanzati che aiutano a rimuovere rumori e segnali falsi, e aumentare il pote
Scalper Inside PRO
Alexey Minkov
4.75 (57)
An exclusive indicator that utilizes an innovative algorithm to swiftly and accurately determine the market trend. The indicator automatically calculates opening, closing, and profit levels, providing detailed trading statistics. With these features, you can choose the most appropriate trading instrument for the current market conditions. Additionally, you can easily integrate your own arrow indicators into Scalper Inside Pro to quickly evaluate their statistics and profitability. Scalper Inside
ATTUALMENTE SCONTATO DEL 26% La soluzione migliore per ogni principiante o trader esperto! Questo indicatore è uno strumento di trading unico, di alta qualità e conveniente perché abbiamo incorporato una serie di caratteristiche proprietarie e una nuova formula. Con un solo grafico è possibile leggere la forza delle valute per 28 coppie Forex! Immaginate come migliorerà il vostro trading perché sarete in grado di individuare l'esatto punto di innesco di una nuova tendenza o di un'opportunit
TPSpro RFI Levels
Roman Podpora
4.8 (15)
Reversal First Impulse levels (RFI)    INSTRUCTIONS        RUS       -       ENG              R ecommended to use with an indicator   -   TREND PRO -  Version MT5 A key element in trading is zones or levels from which decisions to buy or sell a trading instrument are made. Despite attempts by major players to conceal their presence in the market, they inevitably leave traces. Our task was to learn how to identify these traces and interpret them correctly. Main functions: Displaying active zones
FX Volume
Daniel Stein
4.6 (35)
Ricevi il tuo aggiornamento quotidiano sul mercato con dettagli e schermate tramite il nostro Morning Briefing qui su mql5 e su Telegram ! FX Volume è il PRIMO e UNICO indicatore di volume che fornisce una visione REALE del sentiment del mercato dal punto di vista del broker. Fornisce informazioni straordinarie su come gli operatori di mercato istituzionali, come i broker, sono posizionati sul mercato Forex, molto più velocemente dei rapporti COT. Vedere queste informazioni direttamente sul vo
Trend Punch
Mohamed Hassan
4.86 (7)
Manual guide:   Click here WEEKEND PROMO of  $79!  -- Next price is  $149 .  This indicator is unstoppable when combined with our other indicator called  Support & Resistance . After purchase, send us a message and you will get it   for  FREE as a BONUS! I like to use Trend Punch on XAUUSD on the M1 timeframe!  Introducing Trend Punch , the revolutionary forex trend indicator that will transform the way you trade! Trend Punch is uniquely designed to provide precise buy and sell arr
TPSproTREND PrO
Roman Podpora
4.78 (18)
TPSpro TRENDPRO  - is a trend indicator that automatically analyzes the market and provides information about the trend and each of its changes, as well as giving signals for entering trades without redrawing! The indicator uses each candle, analyzing them separately. referring to different impulses - up or down impulse. Exact entry points into transactions for currencies, crypto, metals, stocks, indices!  -  Version MT5               DETAILED DESCRIPTION                R ecommended to use with
FX Power MT4 NG
Daniel Stein
5 (10)
Ricevi il tuo aggiornamento quotidiano sul mercato con dettagli e schermate tramite il nostro Morning Briefing qui su mql5 e su Telegram ! FX Power MT4 NG è la nuova generazione del nostro popolare misuratore di forza delle valute, FX Power. Cosa offre questo misuratore di forza di nuova generazione? Tutto ciò che avete amato dell'FX Power originale IN PIÙ Analisi della forza di ORO/XAU Risultati di calcolo ancora più precisi Periodi di analisi configurabili individualmente Limite di calcolo pe
Gold Stuff
Vasiliy Strukov
4.89 (257)
Gold Stuff è un indicatore di tendenza progettato specificamente per l'oro e può essere utilizzato anche su qualsiasi strumento finanziario. L'indicatore non ridisegna e non è in ritardo. Periodo consigliato H1. Su di esso l'indicatore funziona in modo completamente automatico Expert Advisor EA Gold Stuff. Lo trovi nel mio profilo. I risultati in tempo reale possono essere visualizzati qui.  Puoi ottenere una copia gratuita del nostro indicatore Strong Support e Trend Scanner, per favore scri
Enigmera
Ivan Stefanov
5 (2)
ENIGMERA: Il cuore del mercato https://www.enigmera.com Introduzione Questo indicatore e sistema di trading rappresenta un approccio straordinario ai mercati finanziari. ENIGMERA utilizza i cicli frattali per calcolare con precisione i livelli di supporto e resistenza. Mostra l'autentica fase di accumulazione e fornisce direzione e obiettivi.  Un sistema che funziona sia in un trend che in una correzione.  Come funziona? ENIGMERA è composto da tre linee: la linea di supporto/resistenza, la
Break and Retest
Mohamed Hassan
4.33 (12)
New update to V.4 where  Break & Retest automatically draws the take profit & stop loss levels and you also have more signals per day! ‍You can visually backtest Break & Retest to see how it behaved in the past!     Manual guide:   Click here $60 for a very limited time. Next price is $120   This Indicator only places quality trades when the market is really in your favor with a clear break and retest. Patience is key with this price action strategy! If you want more alert s
Gann Swing Structure
Kirill Borovskii
5 (1)
This indicator is based on the mathematics of the great trader W.D. Ganna. With its help, you can easily find strong levels by analyzing swings to find the optimal entry point. The indicator works on all instruments and all timeframes. The indicator is fully manual and has control buttons. All you need to do is press the NEW button, a segment will appear, which you can place on any movement, swing or even 1 candle that you want to analyze. By placing the segment, press the OK button. A grid (th
Attualmente 20% di sconto! La soluzione migliore per ogni principiante o trader esperto! Questo software per cruscotti funziona su 28 coppie di valute. Si basa su 2 dei nostri indicatori principali (Advanced Currency Strength 28 e Advanced Currency Impulse). Offre un'ottima panoramica dell'intero mercato Forex. Mostra i valori di forza delle valute avanzate, la velocità di movimento delle valute e i segnali per 28 coppie Forex in tutti i (9) timeframe. Immaginate come migliorerà il vostro t
Innanzitutto, vale la pena sottolineare che questo Strumento di Trading è un Indicatore Non-Ridipingente, Non-Ridisegnante e Non-Laggante, il che lo rende ideale per il trading professionale. Corso online, manuale utente e demo. L'Indicatore Smart Price Action Concepts è uno strumento molto potente sia per i nuovi che per i trader esperti. Racchiude più di 20 utili indicatori in uno solo, combinando idee di trading avanzate come l'Analisi del Trader del Circolo Interno e le Strategie di Trading
Advanced Supply Demand
Bernhard Schweigert
4.92 (311)
CURRENTLY 26% OFF !! Best Solution for any Newbie or Expert Trader! This indicator is a unique, high quality and affordable trading tool because we have incorporated a number of proprietary features and a new formula. With this update, you will be able to show double timeframe zones. You will not only be able to show a higher TF but to show both, the chart TF, PLUS the higher TF: SHOWING NESTED ZONES. All Supply Demand traders will love it. :) Important Information Revealed Maximize the potenti
Entry Points Pro
Yury Orlov
4.7 (225)
Indicatore top per MT5 che fornisce segnali accurati per entrare in un trade senza riverniciare! Può essere applicato a qualsiasi attività finanziaria: forex, criptovalute, metalli, azioni, indici.  La versione MT5 è qui Fornirà segnali di trading piuttosto precisi e ti dirà quando è meglio aprire un trade e chiuderlo. Guarda il video (6:22) con un esempio di elaborazione di un solo segnale che ha ripagato l'indicatore! La maggior parte dei trader migliora i propri risultati di trading
PRO Renko System
Oleg Rodin
5 (25)
PRO Renko System è un sistema di trading altamente accurato appositamente progettato per il trading di grafici RENKO. Questo è un sistema universale che può essere applicato a vari strumenti di trading. Il sistema neutralizza efficacemente il cosiddetto rumore di mercato che consente di accedere a segnali di inversione accurati. L'indicatore è molto facile da usare e ha un solo parametro responsabile della generazione del segnale. Puoi facilmente adattare lo strumento a qualsiasi strumento
Market Reversal Alerts
LEE SAMSON
4.21 (121)
Il profitto dalla struttura del mercato cambia quando il prezzo si inverte e si ritira. L'indicatore di avviso di inversione della struttura del mercato identifica quando una tendenza o un movimento di prezzo si sta avvicinando all'esaurimento e pronto a invertire. Ti avvisa dei cambiamenti nella struttura del mercato che in genere si verificano quando stanno per verificarsi un'inversione o un forte pullback. L'indicatore identifica inizialmente i breakout e lo slancio del prezzo, ogni volta
Advanced Currency IMPULSE with ALERT
Bernhard Schweigert
4.91 (494)
ATTUALMENTE SCONTATO DEL 31%! La soluzione migliore per ogni principiante o trader esperto! Questo indicatore è uno strumento di trading unico, di alta qualità e conveniente perché abbiamo incorporato una serie di caratteristiche proprietarie e una formula segreta. Con un solo grafico fornisce avvisi per tutte le 28 coppie di valute. Immaginate come migliorerà il vostro trading perché sarete in grado di individuare l'esatto punto di innesco di una nuova tendenza o opportunità di scalping!
Dragon Multi Indicator MT4
Mansour Babasafary
5 (4)
3 Indicators in 1 indicator Strategy based on price action Made specifically for the best forex currency pairs Can be used in the best time frame of the market at a very reasonable price This indicator is basically 3 different indicatos . But we have combined these 3 indicators in 1 indicator so that you can use 3 indicators at the lowest price. All three strategies are based on price action. But based on different trends. Long term, medium term and short term Attributes : No repaintin
TrendDecoder Premium
Christophe Pa Trouillas
5 (5)
Identificare i range e le prossime mosse probabili   |  Ottenere i primi segnali e la forza delle tendenze   |  Ottenere uscite chiare prima dell'inversione   |  Individuare i livelli di Fibo che il prezzo testerà Indicatore non tracciante e non ritardato - ideale per il trading manuale e automatizzato - adatto a tutti gli asset e a tutte le unità temporali Offerta limitata nel tempo >>   50% OFF Dopo l'acquisto, contattatemi su questo canale  per le impostazioni personalizzate. Versione   MT5 :
Scopri il segreto per il trading Forex di successo con il nostro indicatore MT4 personalizzato! Ti sei mai chiesto come raggiungere il successo nel mercato Forex, guadagnando costantemente profitti minimizzando il rischio? Ecco la risposta che hai cercato! Permettici di presentare il nostro indicatore MT4 proprietario che rivoluzionerà il tuo approccio al trading. Versatilità unica Il nostro indicatore è appositamente progettato per gli utenti che preferiscono le formazioni di candele Ren
M1 Arrow
Oleg Rodin
5 (14)
Una strategia intraday basata su due principi fondamentali del mercato. L'algoritmo si basa sull'analisi dei volumi e delle onde di prezzo utilizzando filtri aggiuntivi. L'algoritmo intelligente dell'indicatore fornisce un segnale solo quando due fattori di mercato si combinano in uno solo. L'indicatore calcola le onde di un certo intervallo sul grafico M1 utilizzando i dati dell'intervallo di tempo più alto. E per confermare l'onda, l'indicatore utilizza l'analisi per volume. Questo indicatore
ICT, SMC, SMART MONEY CONCEPTS, SMART MONEY, Smart Money Concept, Support and Resistance, Trend Analysis, Price Action, Market Structure, Order Blocks, BOS/CHoCH,   Breaker Blocks ,  Momentum Shift,   Supply&Demand Zone/Order Blocks , Strong Imbalance, HH/LL/HL/LH,    Fair Value Gap, FVG,  Premium  &   Discount   Zones, Fibonacci Retracement, OTE, Buy Side Liquidity, Sell Side Liquidity, BSL/SSL Taken, Equal Highs & Lows, MTF Dashboard, Multiple Time Frame, BigBar, HTF OB, HTF Market Structure, 
TrendMaestro
Stefano Frisetti
5 (3)
nota: questo indicatore e' per METATRADER4, se vuoi la versione per  METATRADER5 questo e' il link:  https://www.mql5.com/it/market/product/108123 TRENDMAESTRO ver 2.4 TRENDMAESTRO riconosce un nuovo TREND sul nascere, non sbaglia mai. La sicurezza di identificare un nuovo TREND non ha prezzo. DESCRIZIONE TRENDMAESTRO identifica un nuovo TREND sul nascere, questo indicatore prende in esame la volatilita' i volumi ed il momentum per identificare il momento in cui c'e' un'esplosione di uno 
PZ Trend Trading
PZ TRADING SLU
4.75 (4)
Trend Trading is an indicator designed to profit as much as possible from trends taking place in the market, by timing pullbacks and breakouts. It finds trading opportunities by analyzing what the price is doing during established trends. [ Installation Guide | Update Guide | Troubleshooting | FAQ | All Products ] Trade financial markets with confidence and efficiency Profit from established trends without getting whipsawed Recognize profitable pullbacks, breakouts and early reversals The ind
Full Forex Market View Dashboard
Opengates Success International
5 (2)
VISUALIZZAZIONE COMPLETA DEL MERCATO FOREX Indicatore del cruscotto Questo è un indicatore personalizzato creato per offrire ai trader una visione completa di ciò che sta accadendo nel mercato. Utilizza dati in tempo reale per accedere al mercato e visualizzare tutte le informazioni necessarie per fare trading di successo. INSTALLAZIONE: Prima di allegare questo indicatore al grafico della finestra, vai al pannello Market Watch del tuo MT4 e NASCONDI tutte le coppie di valute che non ti
ECM Channel MT4
Paulo Rocha
5 (1)
ECM Elite Channel is a volatility-based indicator, developed with a specific time algorithm, which consists of finding possible corrections in the market. This indicator shows two outer lines, an inner line (retracement line) and an arrow sign, where the channel theory is to help identify overbought and oversold conditions in the market. The market price will generally fall between the boundaries of the channel. If prices touch or move outside the channel, it's a trading opportunity. The
Presentazione       Quantum Trend Sniper Indicator   , l'innovativo indicatore MQL5 che sta trasformando il modo in cui identifichi e scambi le inversioni di tendenza! Sviluppato da un team di trader esperti con un'esperienza di trading di oltre 13 anni,       Indicatore Quantum Trend Sniper       è progettato per spingere il tuo viaggio di trading verso nuove vette con il suo modo innovativo di identificare le inversioni di tendenza con una precisione estremamente elevata. *** Acquista Quant
Altri dall’autore
Super Trend eu
Emin Ulucanli
4.75 (4)
SUPERTREND; È un indicatore di trend following basato sull'ATR SuperTrend creato da Olivier Seban. Può essere utilizzato per rilevare i cambiamenti nella direzione del trend e individuare gli arresti. Quando il prezzo scende al di sotto della curva dell'indicatore, diventa rosso e indica una tendenza al ribasso. Al contrario, quando il prezzo si sposta al di sopra della curva, l'indicatore diventa verde, indicando un trend rialzista. Come altri indicatori, funziona bene su SuperTrend se utilizza
FREE
Pivot Classic, Woodie, Camarilla, Fibonacci and Demark Floor/Classic I punti pivot, o semplicemente pivot, sono utili per identificare potenziali livelli di supporto/resistenza, range di trading, inversioni di tendenza e sentiment di mercato esaminando i valori massimi, minimi e di chiusura di un asset. I Pivot Point Floor/Classic possono essere calcolati come segue. Pivot Point (P) = (High + Low + Close)/3 S1 = P * 2 - High S2 = P - (High - Low) S3 = Low – 2*(High - P) R1 = P * 2 - Low R2 = P +
FREE
Tillson TMA T3
Emin Ulucanli
5 (5)
TILLSON MOVING AVERAGE Conosciuto anche come indicatore TMA o T3. È una media mobile che utilizza EMA e DEMA nella sua formula ed è calcolata con un'espansione binomiale di 3 grado.       ...    int      handle1;     //Handle of the Tillson TMA T3.EX5 custom indicator    double   euBuff1[];    int TMAperiod= 12 ;    int TMSshift= 0 ;    double VolumeFactor= 0.618 ;    int OnInit ()    {    ...    handle1= iCustom ( NULL , PERIOD_CURRENT , "Market\\Tillson TMA T3.EX5" ,0,TMAperiod,0,0,TMSshift,0
FREE
DONCHIAN CHANNEL DC È un indicatore di tendenza sviluppato da “Richard Donchian”, composto da 3 strati, il canale superiore, il canale inferiore e il canale centrale. Viene creato sul canale Donchian tracciando sul grafico dei prezzi i prezzi più alti e più bassi raggiunti nel periodo passato. Viene utilizzato anche per misurare la volatilità del mercato, in quanto è un canale in espansione/contrazione in base all'aumento/diminuzione della volatilità dei prezzi. Method 0; Disegno dell'indicatore
FREE
Pivot Classic, Woodie, Camarilla, Fibonacci and Demark Floor/Classic I punti pivot, o semplicemente pivot, sono utili per identificare potenziali livelli di supporto/resistenza, range di trading, inversioni di tendenza e sentiment di mercato esaminando i valori massimi, minimi e di chiusura di un asset. I Pivot Point Floor/Classic possono essere calcolati come segue. Pivot Point (P) = (High + Low + Close)/3 S1 = P * 2 - High S2 = P - (High - Low) S3 = Low – 2*(High - P) R1 = P * 2 - Low R2 = P
FREE
DONCHIAN CHANNEL DC È un indicatore di tendenza sviluppato da “Richard Donchian”, composto da 3 strati, il canale superiore, il canale inferiore e il canale centrale. Viene creato sul canale Donchian tracciando sul grafico dei prezzi i prezzi più alti e più bassi raggiunti nel periodo passato. Viene utilizzato anche per misurare la volatilità del mercato, in quanto è un canale in espansione/contrazione in base all'aumento/diminuzione della volatilità dei prezzi. Method 0; Disegno dell'indicatore
FREE
Filtro:
Nessuna recensione
Rispondi alla recensione
Versione 1.20 2023.01.28
Qualche piccola modifica
Versione 1.10 2023.01.14
Sono state apportate piccole modifiche.

alle impostazioni dell'indicatore
Fattore di volume
Metodo 0
opzioni aggiunte.