YKL Regressao Linear
- Indicatori
- Ygor Keller Luccas
- Versione: 1.20
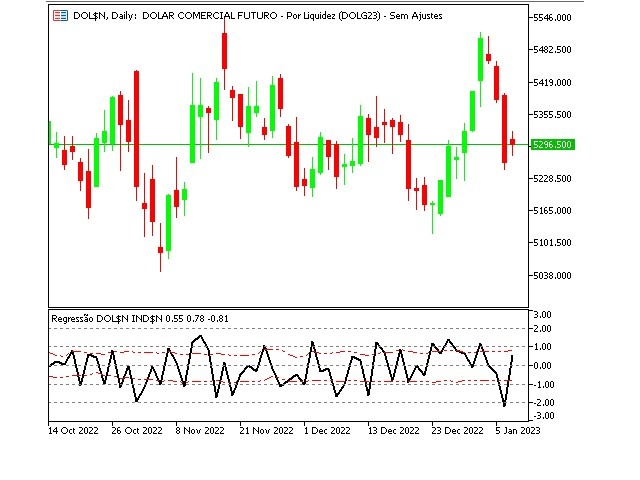
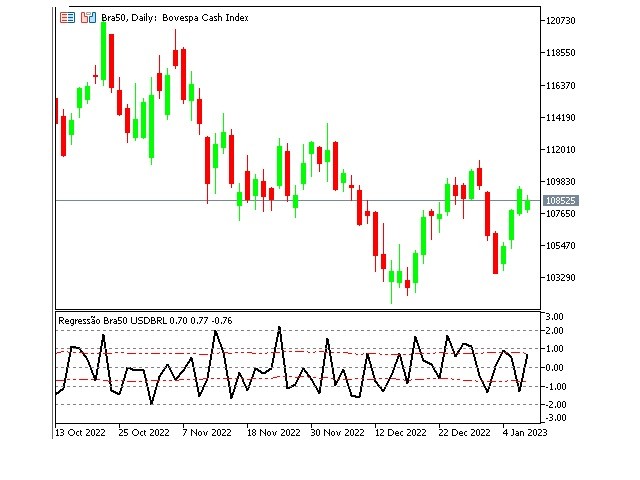
Indicador Regressão Linear – Par de Ativos
Indicador é um oscilador que faz o plot do Resíduo resultado da regressão linear entre os dois ativos inseridos como input do indicador, representado pela fórmula:
Y = aX + b + R
Onde Y é o valor do ativo dependente, X é o valor do ativo independente, a é a inclinação da reta entre os dois ativos, b é a intersecção da reta e R é o resíduo.
O resíduo representa a quantidade da variabilidade que Y que o modelo ajustado não consegue explicar. E os resíduos podem ser calculados com a seguinte fórmula:
Resíduo = Y-Yˆ
Onde Y é o valor real e Y^ é o valor calculado pelo modelo baseado na cointegração entre os dois ativos.
Inputs do indicador:
· Símbolo Dependente: Ativo dependente (Y)
· Símbolo Independente: Ativo independente (X)
· Barras de regressão: número de dias para que seja feita a regressão linear entre os dois ativos
Indicador está otimizado para o par de ativos do WINFUT e WDOFUT da Bolsa Brasileira B3. Indicador é sempre plotado no gráfico diário independente da seleção de timeframe do usuário. Indicador é sempre plotado no gráfico do ativo dependente.