DR IDR Pro
- Indicatori
- Barend Paul Stander
- Versione: 2.7
- Aggiornato: 22 gennaio 2025
- Attivazioni: 5
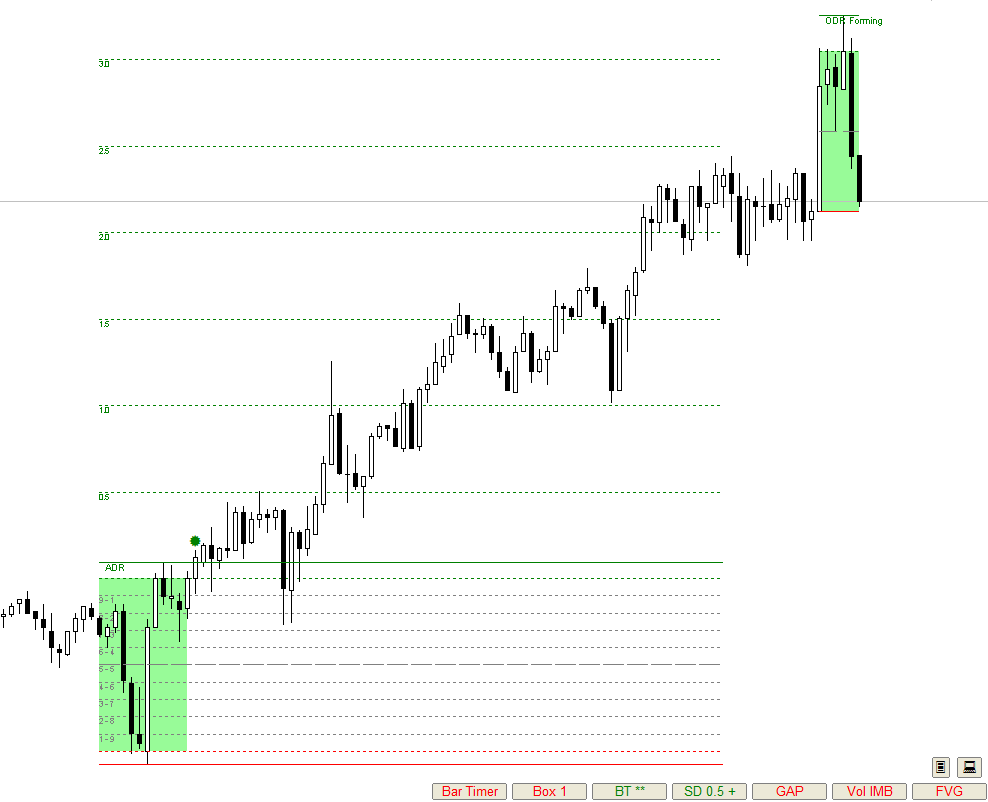
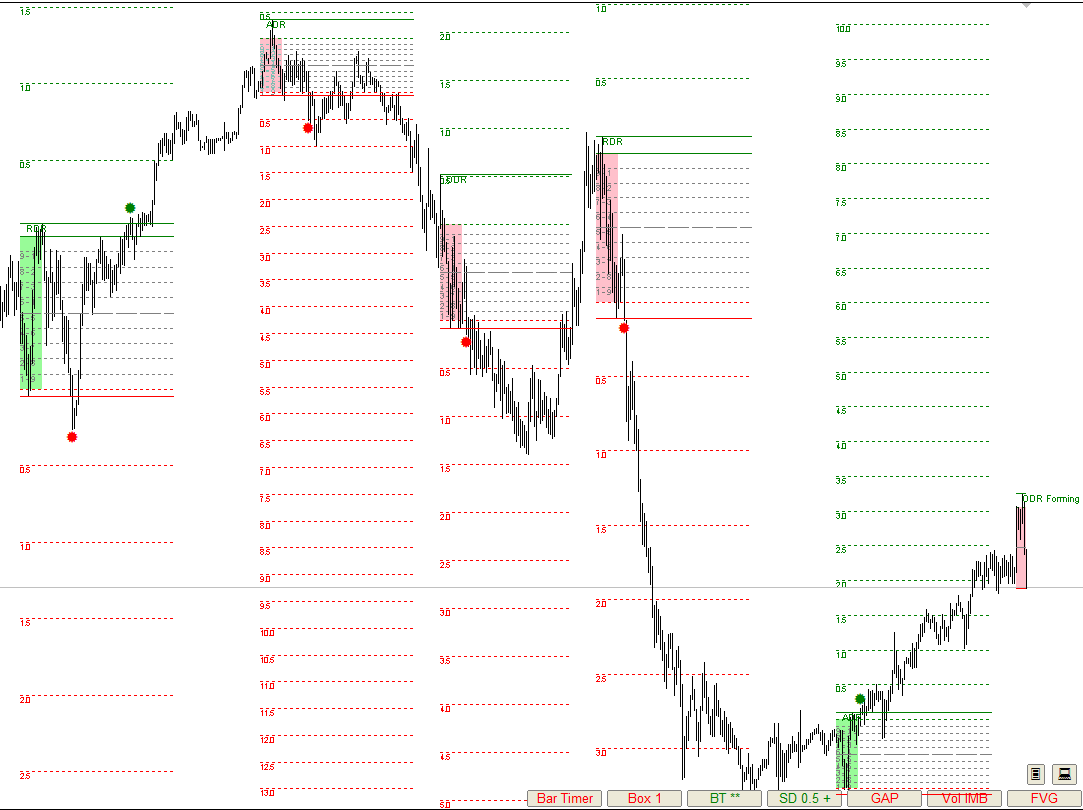
Defining Range ( DR ) and Implied Defining Range ( IDR ) indicator Pro with added features from free version
Show DR and IDR ranges Sessions on the chart for
- RDR Regular defining range (New York Session)
- ADR After defining range (Asian session)
- ODR Outside defining range (London Session)
Buttons on chart to enable / disable :
- Show Imbalance ( IMB )
- Show Volume Imbalance ( VIB )
- Show Gap's between open and close
- Show Standard Deviation ( SD )
- Show last 3 Sessions or Back testing mode with multi day Sessions ( BT )
for more information how DR and IDR work and the high probability watch : https://www.youtube.com/@themas7er
or https://twitter.com/IamMas7er
Remember to set set your chart TimeZone when you attach indicator to the chart under indicator settings / inputs
...


Very nice indicator, and a very nice trading strategy! I have been trying to learn price action for a while, just lacking the consistancy. Glad I come accross your methods. I love how this indicator shows the FVG / imbalances