Ichimoku Trend Alert MT5
- Indicatori
- Amir Atif
- Versione: 3.2
- Aggiornato: 19 giugno 2023
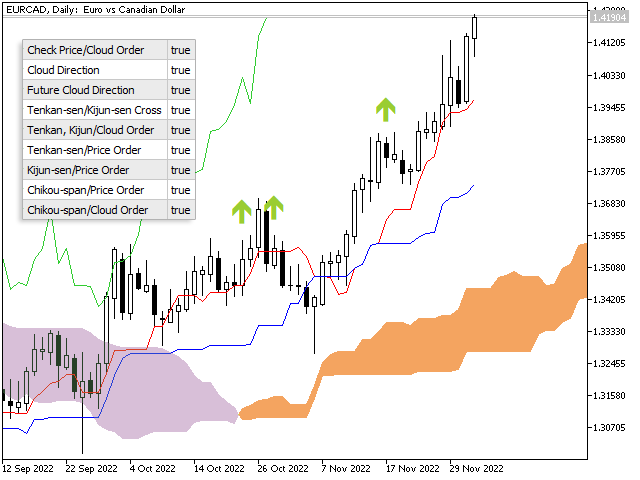
Ichimoku Trend Alert is the Ichimoku Kinko Hyo indicator with Alerts and signal filters.
Ichimoku Trend Alert features:
- Optional check of Ichimoku cloud, Tenkan sen(Conversion Line), Kijun sen(Base Line), Senkou span A, Senkou span B, and Chikou span relative to price, and more.
- Popup, email, and phone notification alerts for selected symbols and timeframes.
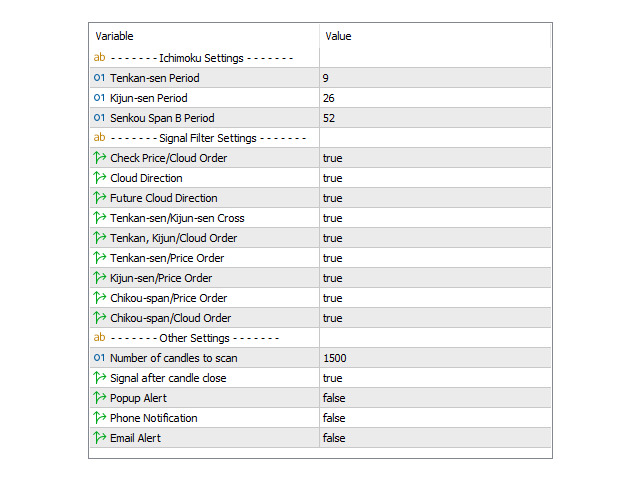
There are 9 classic Ichimoku trend filters you can enable/disable in settings:
Price/Cloud Order: Checks the price position relative to the cloud.
Cloud Direction: Checks the current cloud color to see if its direction turned yet or not.
Future Cloud Direction: Checks if the future cloud direction matches the price/cloud position.
Tenkan-sen/Kijun-sen Cross: Checks if Tenkan sen crossed Kijun sen in the direction of the trend.
Tenkan, Kijun/Cloud Order: Checks if both Tenkan sen and Kijun sen are above the cloud in an uptrend or below the cloud in a downtrend.
Tenkan-sen/Price Order: Checks if price is above Tenkan sen in uptrend or below Tenkan sen in downtrend.
Kijun-sen/Price Order: Checks if price is above Kijun sen in uptrend or below Kijun sen in downtrend.
Chikou-span/Price Order: Checks if Chikou span is above price in uptrend or below price in downtrend.
Chikou-span/Cloud Order: Checks if Chikou span is above the cloud in uptrend or below the cloud in downtrend.
Other Settings
Filter mid-trend signals: If enabled the indicator tries to filter mid/late trend signals. It alerts only if a new signal generates in the opposite direction.
Signal after candle close: If true dashboard waits until the close of the current candle and then checks the signal.
Number of candles to scan: Set here how many bars you want to scan for checking history signals.
Popup Alert: To enable MetaTrader alert window informing dashboard signals on a symbol and timeframe. Select symbols and timeframes that you want to get alert for them by ticking their checkboxes on the panel.
Phone Notification: To receive indicator alerts on the cell phone. For this to work you must enable and fill the MetaTrader push notification settings from the Notifications tab on the MetaTrader options dialog (ctrl+o).
Email Alert: To receive indicator alerts via email. For this to work you must enable and fill the MetaTrader email settings from the Email tab on the MetaTrader options dialog (ctrl+o).
Alert Note: You can type a text here to be added at the beginning of the alert messages.
Dashboard: Ichimoku Trend Finder MT5
MT4 version here
Note
The signals of this indicator are not Buy/Sell signals. They indicate a potential market trend that should be checked. If you have a particular Ichimoku trading system you can set up the indicator accordingly to get buy/sell signals.


Gostei