Visual Bollinger Bands Divergence
- Indicatori
- Luiz Felipe De Oliveira Caldas
- Versione: 1.0
- Attivazioni: 20
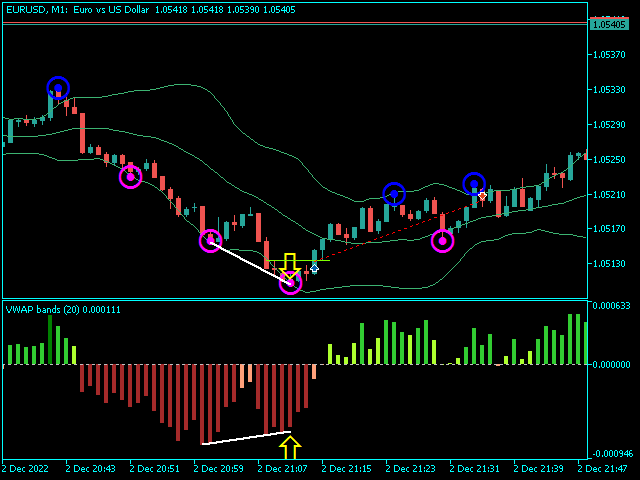
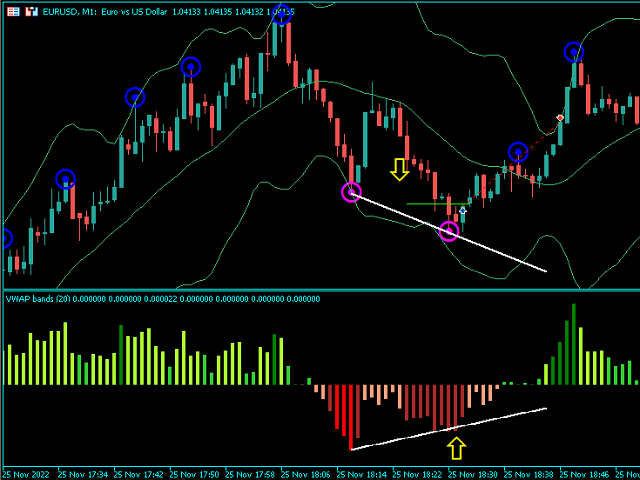
Bande VWAP Stile visivo 1.0
Gli indicatori del mercato finanziario sono strumenti essenziali utilizzati da trader e investitori per analizzare e prendere decisioni nei mercati finanziari. Il VWAP e le bande di Bollinger sono due popolari strumenti di analisi tecnica utilizzati dai trader per misurare le tendenze del mercato e la volatilità dei prezzi. In questo prodotto, proponiamo di combinare i due indicatori per creare un prodotto unico che fornisca un'analisi completa delle tendenze e della volatilità del mercato. Questo prodotto sarà l'ideale per trader e investitori che desiderano prendere decisioni informate basate su analisi basate sui dati.
La strategia di divergenza è una popolare tecnica di analisi tecnica utilizzata dai trader per identificare potenziali inversioni di tendenza nel mercato. La strategia si basa sull'identificazione delle divergenze tra i movimenti dei prezzi e gli indicatori tecnici. In questa sezione, descriveremo la strategia di divergenza utilizzando lo stile visivo e le bande di Bollinger.
La strategia di divergenza che utilizza lo stile visivo e le bande di Bollinger, ad esempio, è una popolare tecnica di analisi tecnica utilizzata dai trader per identificare potenziali inversioni di tendenza nel mercato. La strategia si basa sull'identificazione delle divergenze tra l'RSI e l'azione del prezzo del titolo. Utilizzando questa strategia, i trader possono prendere decisioni informate basate su analisi basate sui dati, portando a operazioni e investimenti più redditizi.


L'utente non ha lasciato alcun commento sulla valutazione.