The Real Supertrend
- Indicatori
- David Hausberger
- Versione: 1.0
- Attivazioni: 10
The Legendary Super Trend Indicator Now at Savings Price!!!!!
My Supertrend indicator gives them clear entry and exit signals.
The indicator is volatility-based and is in its function rather a trend-following indicator.
Through the ATR indicator, which is integrated in the calculation of the Supertrend, price gaps are also calculated and not overlooked. Thus, more accurate values can be calculated.
When measuring volatility, the average value of the current price serves as a basis.
Since the Supertrend indicator is characterized by moving stop and reversal lines, it is quite similar to the Parabolic SAR indicator in its function.
The Supertrend indicator always moves in the direction of the trend.
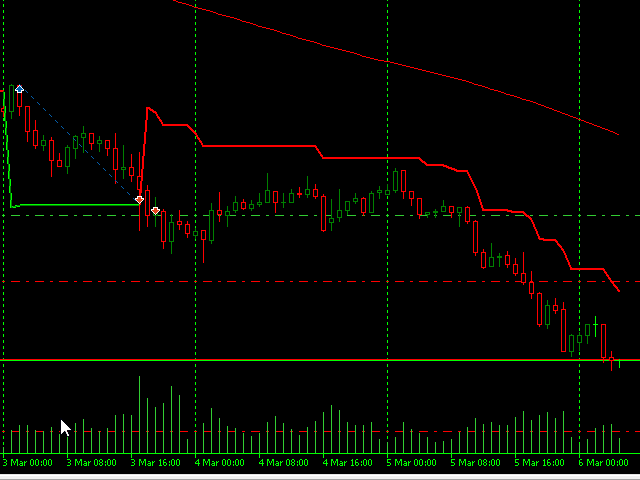
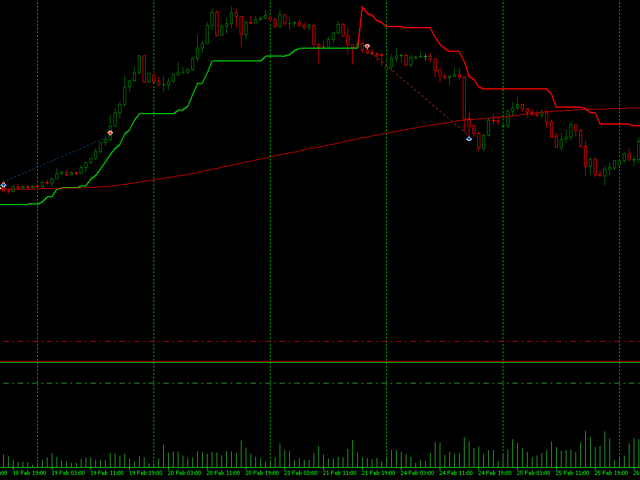
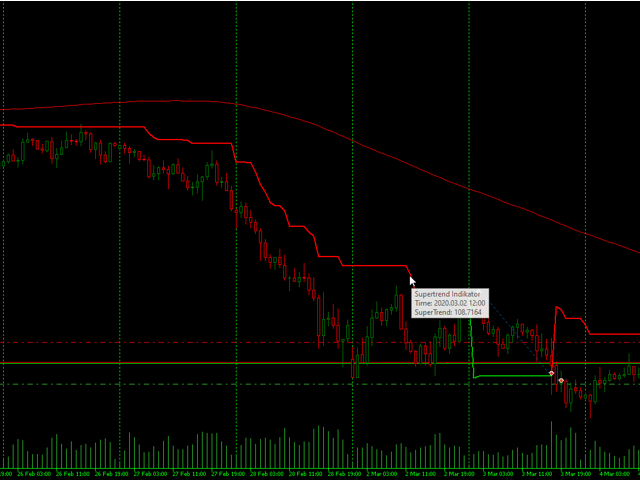
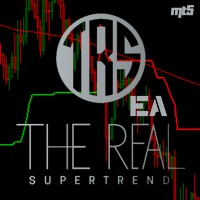
The indicator puts a red and a green line across the chart. The green line represents an uptrend, the red line represents a downtrend.
The trend reverses when an existing support or resistance level is crossed.
When a price breaks downward through a signal line, it means a potential sell signal. When a price crosses upward through the signal line, it means a potential buy signal.
The "periods" and the "factor" of the super trend for displaying the signal line can be set individually. By default, these are set to ten (periods) and three (factor). By modification, support and resistance levels can be set tighter or wider.
