Wycoff For Intraday And Swing Trading
- Indicatori
- Dhabaleswar Prasad Jena
- Versione: 3.2
- Aggiornato: 10 novembre 2022
- Attivazioni: 5
Please follow the "How To Trade" instructions exactly for best results
Wycoff theory is vastly used by institutional traders but when it comes to retail traders the concept isn't well understood by most. It is even more difficult to implement in intraday & swing trading. This No REPAINT indicator helps you in analyzing the market cycles and plots buy/sell signals at the start of trending phase. It studies the market strength of bulls and bears and does a effort Vs reward matrix calculation before generating trading signals. This is a all weather indicator that works in all timeframes and for all kind of markets, eg - stocks, currency pair or even crypto.
Parameters
- All colour options are self-explanatory
- rangeClr - color of the range signal arrow (this is an early sign of trades to happen during the consolidation phase)
- showCross - to switchoff the signal. Set it TRUE
- move - distance of the signal arrow from candle. Keep it 20
- emaPeriod - the baseline average that Wyckoff uses. Keep it 20
- closePercent - Defines the strength of the signal. Keep it 80 for optimal result
- pipPercent - size of the signal candle. Suggestion is to keep it at 0.13 but you can try till 0.20
- prevCandleCheck - Does the analysis of previous consolidation phase for better signals. Keep it TRUE
- maxCandleCheck - number of candles it should consider for consolidation phase. Keep it 10
- showUniqueSig - to show unique signals. Keep it TRUE
- sendAlert - sends alert on the terminal when there is a signal arrow. Keep it TRUE
- checkFourthCandle - checks fourth candle rise/fall/slope in the consolidation phase for better result. Keep it TRUE
- checkForCandleCount - checks for the momentum in both bull and bear direction during the consolidation phase to determine the strength of the upcoming trend phase. Keep it TRUE
- dominantCandleNumber - it calculates the domination of bull and bear during consolidation phase. Keep it 7
How To Trade
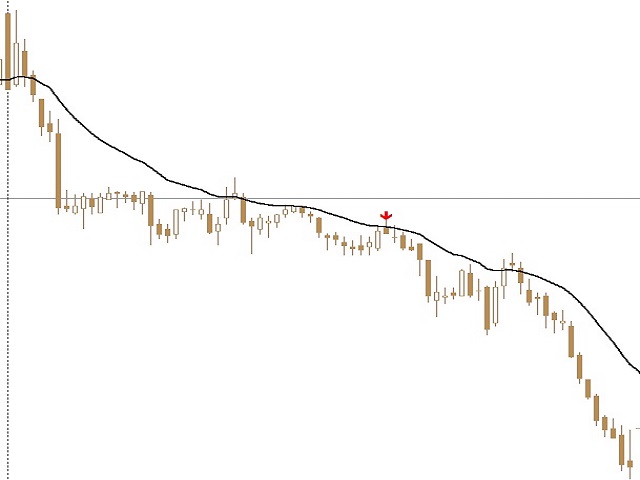
Will elaborate the entry and exit criteria for the BUY setup and the SELL setup is exactly opposite to it.
BUY Trade
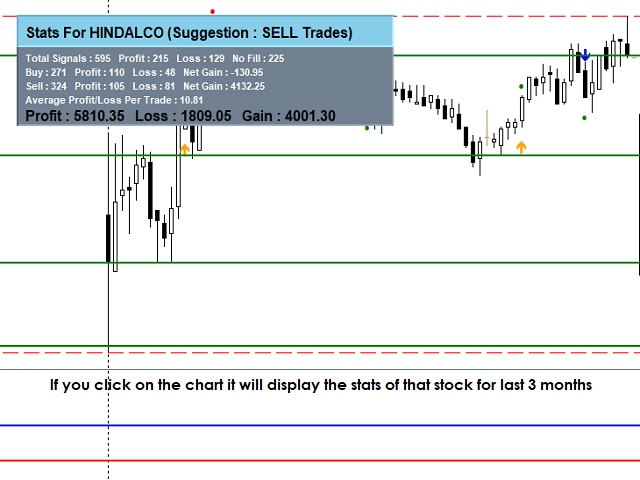
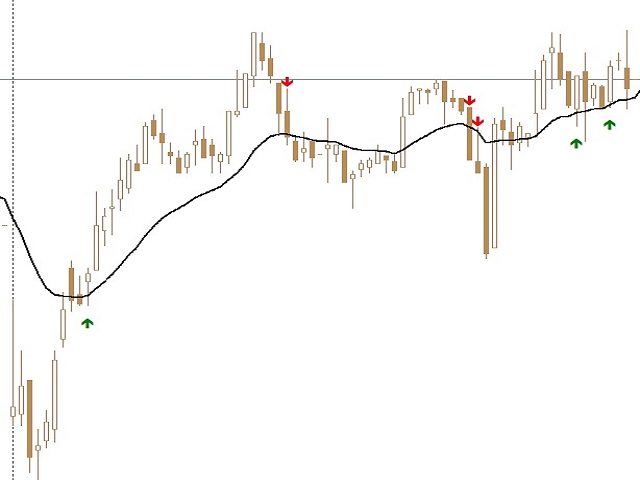
When the BUY arrow comes at the bottom of the candle wait for the price to go a pip or two above the HIGH of the signal bar (it will draw a blue line at the entry price). The price must cross the high in next candle or else the setup is invalid. You can place a limit order at a pip or two above and wait to get filled in next candle max (it will show green or red dots on the signal candle if you get a fill or not by the next candle. Green for fill, Red for no fill). If it fails to cross in next candle then cancel your buy order. Keep the SL 10 pips below the nearest swing low (it will draw the SL line in red).
Exit (At any of the below conditions)
- Your Risk/Reward appetite
- When any of the target (drawn in green lines) is hit
- When an opposing signal comes
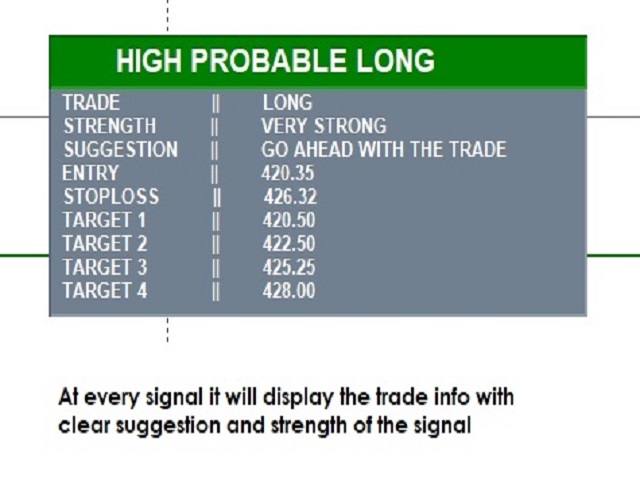
- When the indicator tells you to exit
- When price hits SL or revised SL
Finer Points
The system will trail the SL and show alert for new SL value and will redraw the SL line (in RED) at the new price. When a range candle comes (in the color based on the rangeClr parameter) you can enter/exit the trade in the same manner. It is for aggressive traders as it is an early sign of TREND phase during the consolidation cycle. Since the indicator is for INTRADAY trading the timeframe that best suits is 5 minutes. You can try for 15 minutes but not beyond that. Swing traders can try with 30 minutes or 1,4 hour chart. Scalpers can try even lower timeframe charts as this signal works in all timeframes. While going for a trade please do note that if there is a resistance/support in the form of previous daily, weekly or monthly lines (high or low). Generally those lines are your first target. If any of those lines are too close to give you less than 1:2 Risk-Reward ratio then I would suggest not to go with that trade. Scalpers still can go if it fits their trade management.
Important - Don't take a trade if the stock is in range (Sideways).
There could be multiple signals of same color coming in a row. eg - 3 red or 3 green arrows. This is to help you in getting a re-entry if you had missed the previous signal. If you are already in the trade, this also helps you to change (trail) your SL to the nearest swing high/low with respect to the new signal that is generated.


