TelegramCandleMap
- Utilità
- Serhii Tymchenko
- Versione: 1.0
Telegram Candle Map Barometer.
I wanted to create an informer that would show in the direction of the candle shadows where the price is moving. When I made the first timeframe, I realized that by combining several, I get an excellent breakout entry indicator.
You need to create a Telegram bot for getting an API. Copy main ex4 file to Experts folder and use with settings.
Download and enjoy, even receiving signals from MetaTrader, this is true when trading on any exchange.
What we have inside:
Minimal candle size reaction (I use 1000 for BTC), candle shadow size in percent to candle size (I use 100% good),
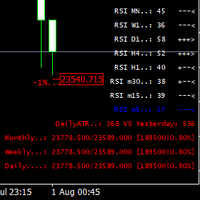
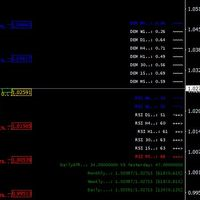
RSI settings is simple (from M5 to Weekly) .
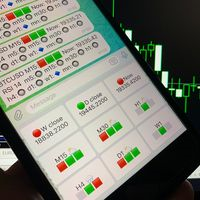
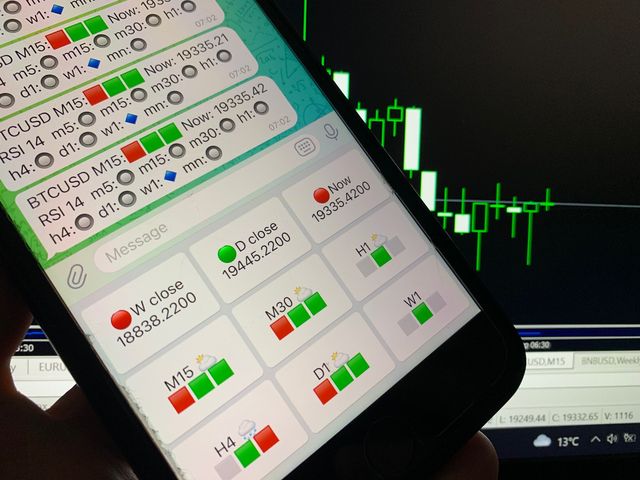
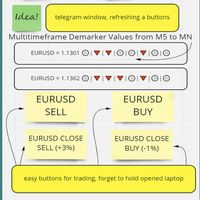
What in buttons:
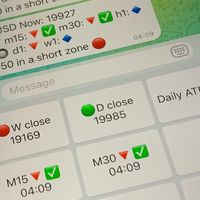
🔴 Weekly close (RED if lower Monthly close,🟢 GREEN is higher)
🔴 Daily close (RED if lower Weekly close, 🟢 GREEN is higher)
Now: showing a current price with 🔴 RED if we lower Daily close or 🟢 GREEN if higher.
Next new and interesting buttons. 6 Timeframes (from M15 to Weekly).
Each one's show: 3 squares, it is 3 last bars of this timeframe from right to left 🟥 🟩 🟩 means that only 2 last bars closed with bullish shadows.
⬜️ Gray means that candle is not matters and no shadow there.
🟩 Green means a strong shadow below a candle for future upward.
🟥 Red means a strong shadow under a candle for dropping a price.
☀️ The Sun near TF means that price higher the high of signal candle bar and it is good for long entry, (The 🌧 Clouds near TF vice versa.)
🚀 Rocket shows when overhighed high breakdown.
⛈ Rain means price overlow through the signal candle
⛅️ Sun behind the cloud -means that overhigh is made but price returned inside the bar.
🌦 Sun after the rain -means that overlow is made but price returned inside the bar.
Try to use it is simple and playable for a good mood.
I will appreciate if you post a comment about how to make it better and if it is easy for use
