KT XMaster Formula MT4
- Indicatori
- KEENBASE SOFTWARE SOLUTIONS
- Versione: 1.0
- Attivazioni: 5
The indicator uses calculations based on moving averages, RSI, and MACD. It is usually appropriate for scalping and trend trading - whether you are a novice or an experienced trader, the signals generated by this indicator are simple to understand and implement.
Overview
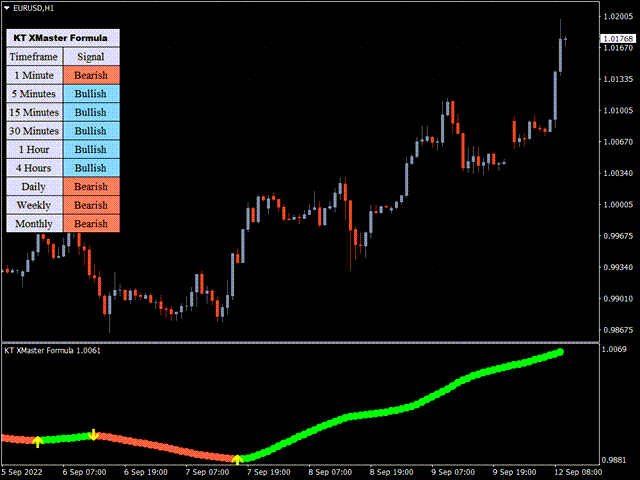
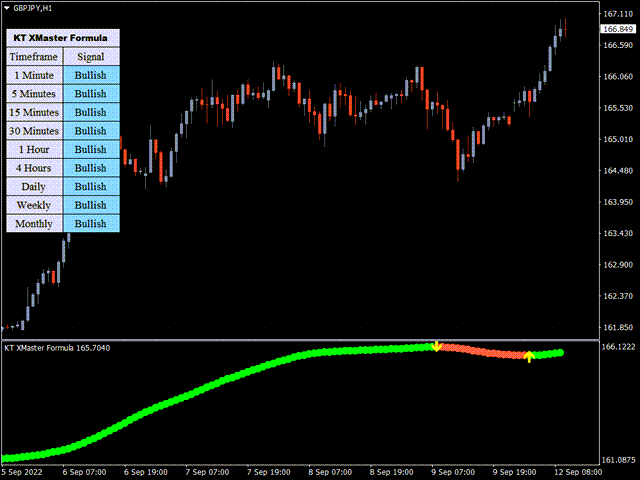
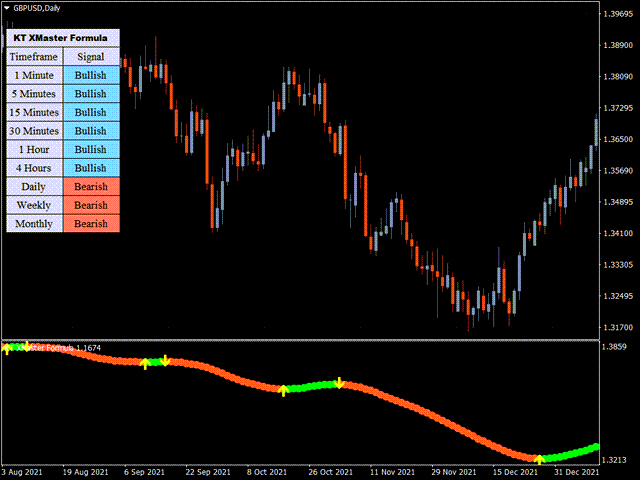
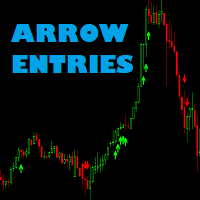
The indicator comprises green and red dots arranged in wavy lines. These dots correspond to market trends.
- The entry signals markets as the yellow up/down arrows.
- The green dots show that the market price is rising.
- The red dots indicate that the market price is falling.
Remember that the green dots are typically thinner than the red dots. This will make it easier for traders to recognize the bullish and bearish trends.
The signal marked by a yellow arrow will appear when the green dot turns red or vice versa if the red dot turns blue. The indicator is suitable for both novice and professional traders.
Buy Signals
- The yellow arrow points upwards.
- Dotted lines turn green.
- Open long position and set stop loss to last swing low point.
- Take profit or exit trade once opposite signals are observed or when the indicator turns red.
Sell Signals
- The yellow arrow is pointing downward.
- Dotted lines become red.
- Open a short position with a stop loss at the high point of the previous swing.
- When you see opposite signals or the indicator turns green, take profit or exit the trade.
