Volatility analyzer with alerts for MT4
- Indicatori
- STE S.S.COMPANY
- Versione: 1.1
- Attivazioni: 10
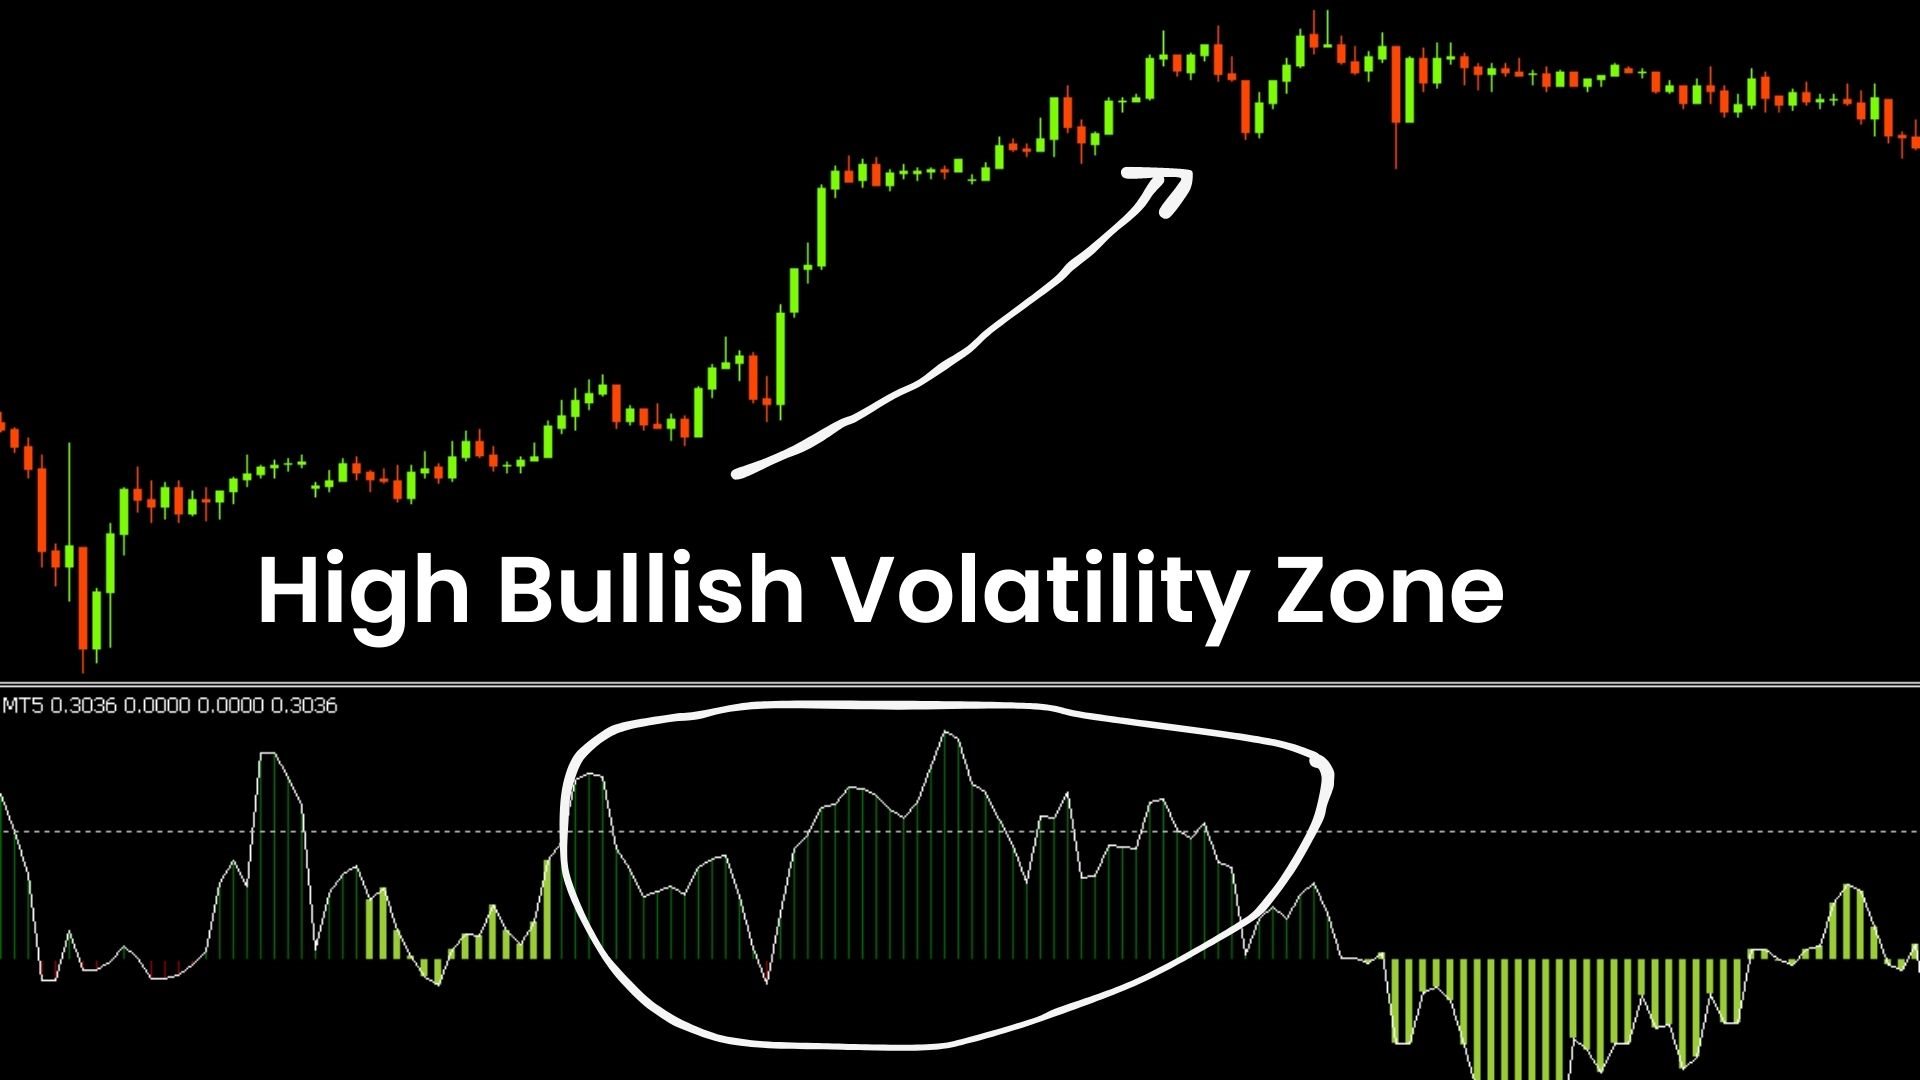
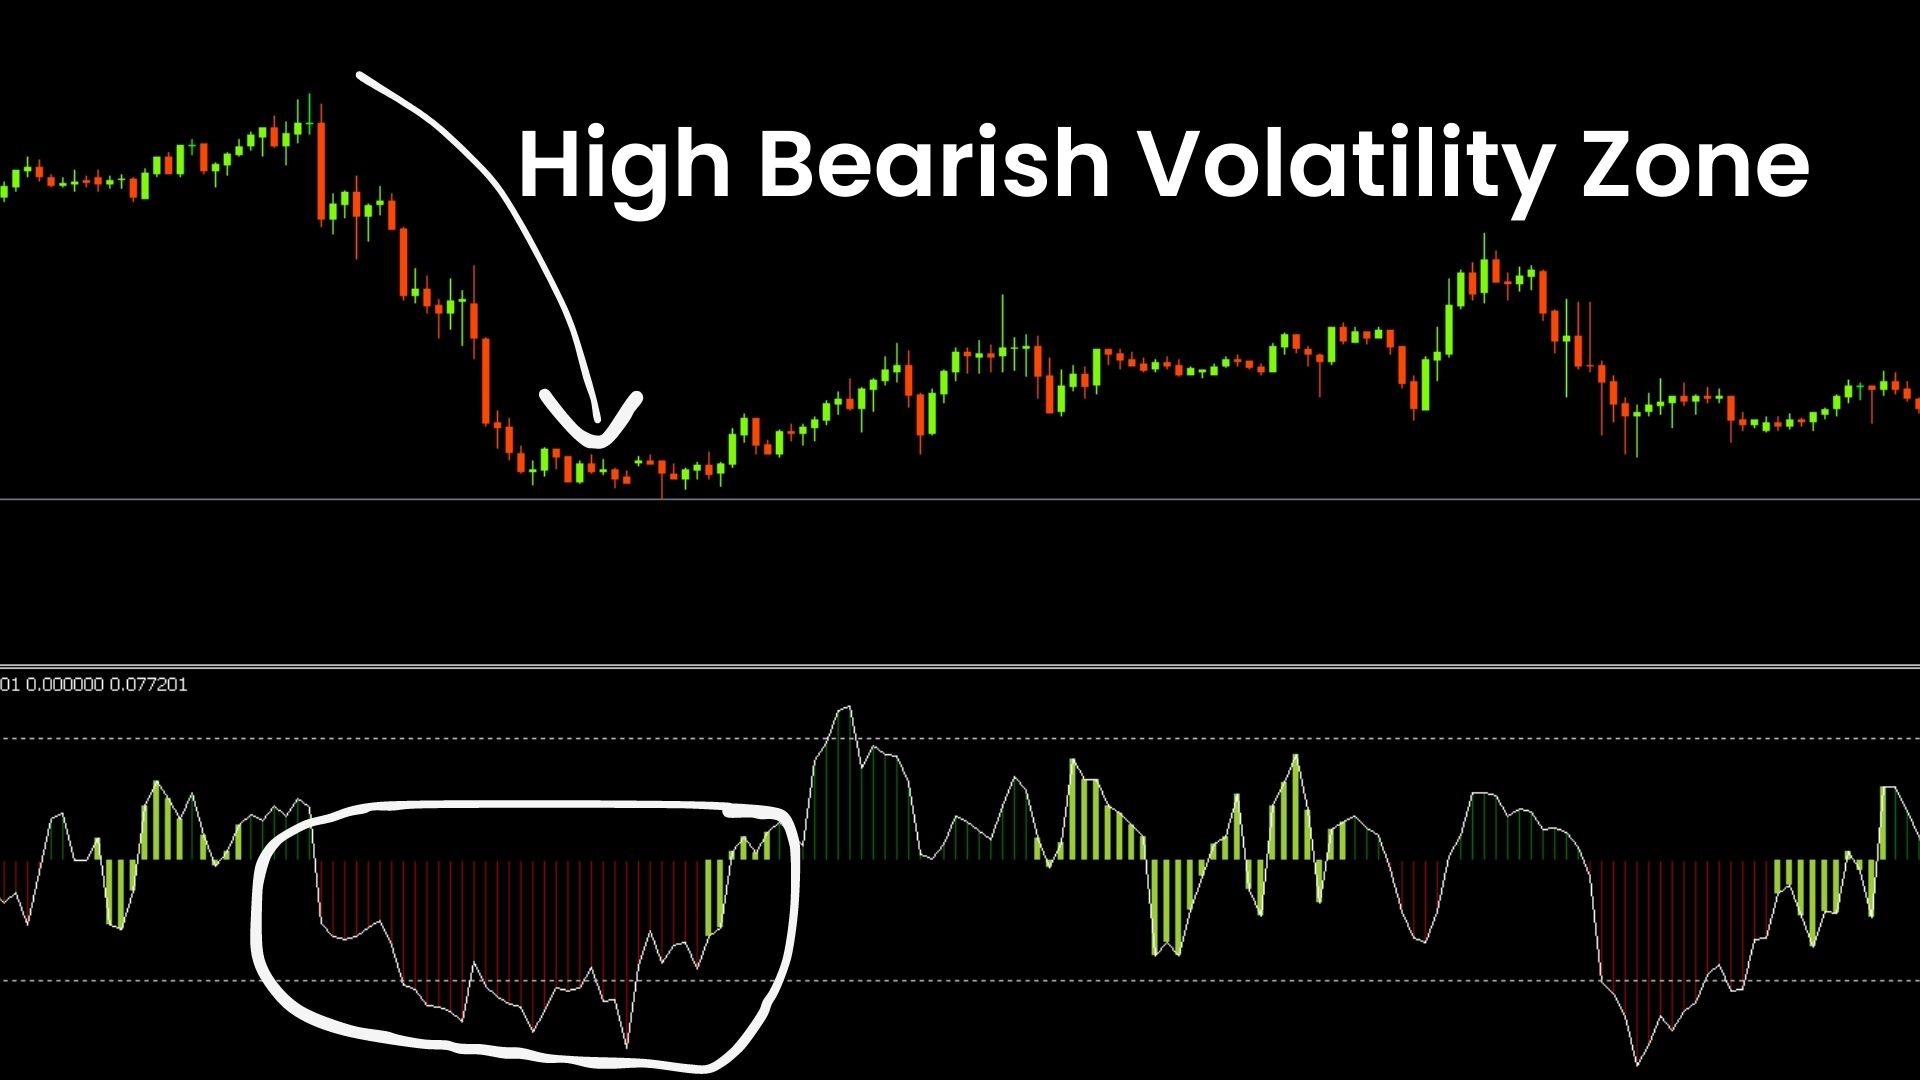
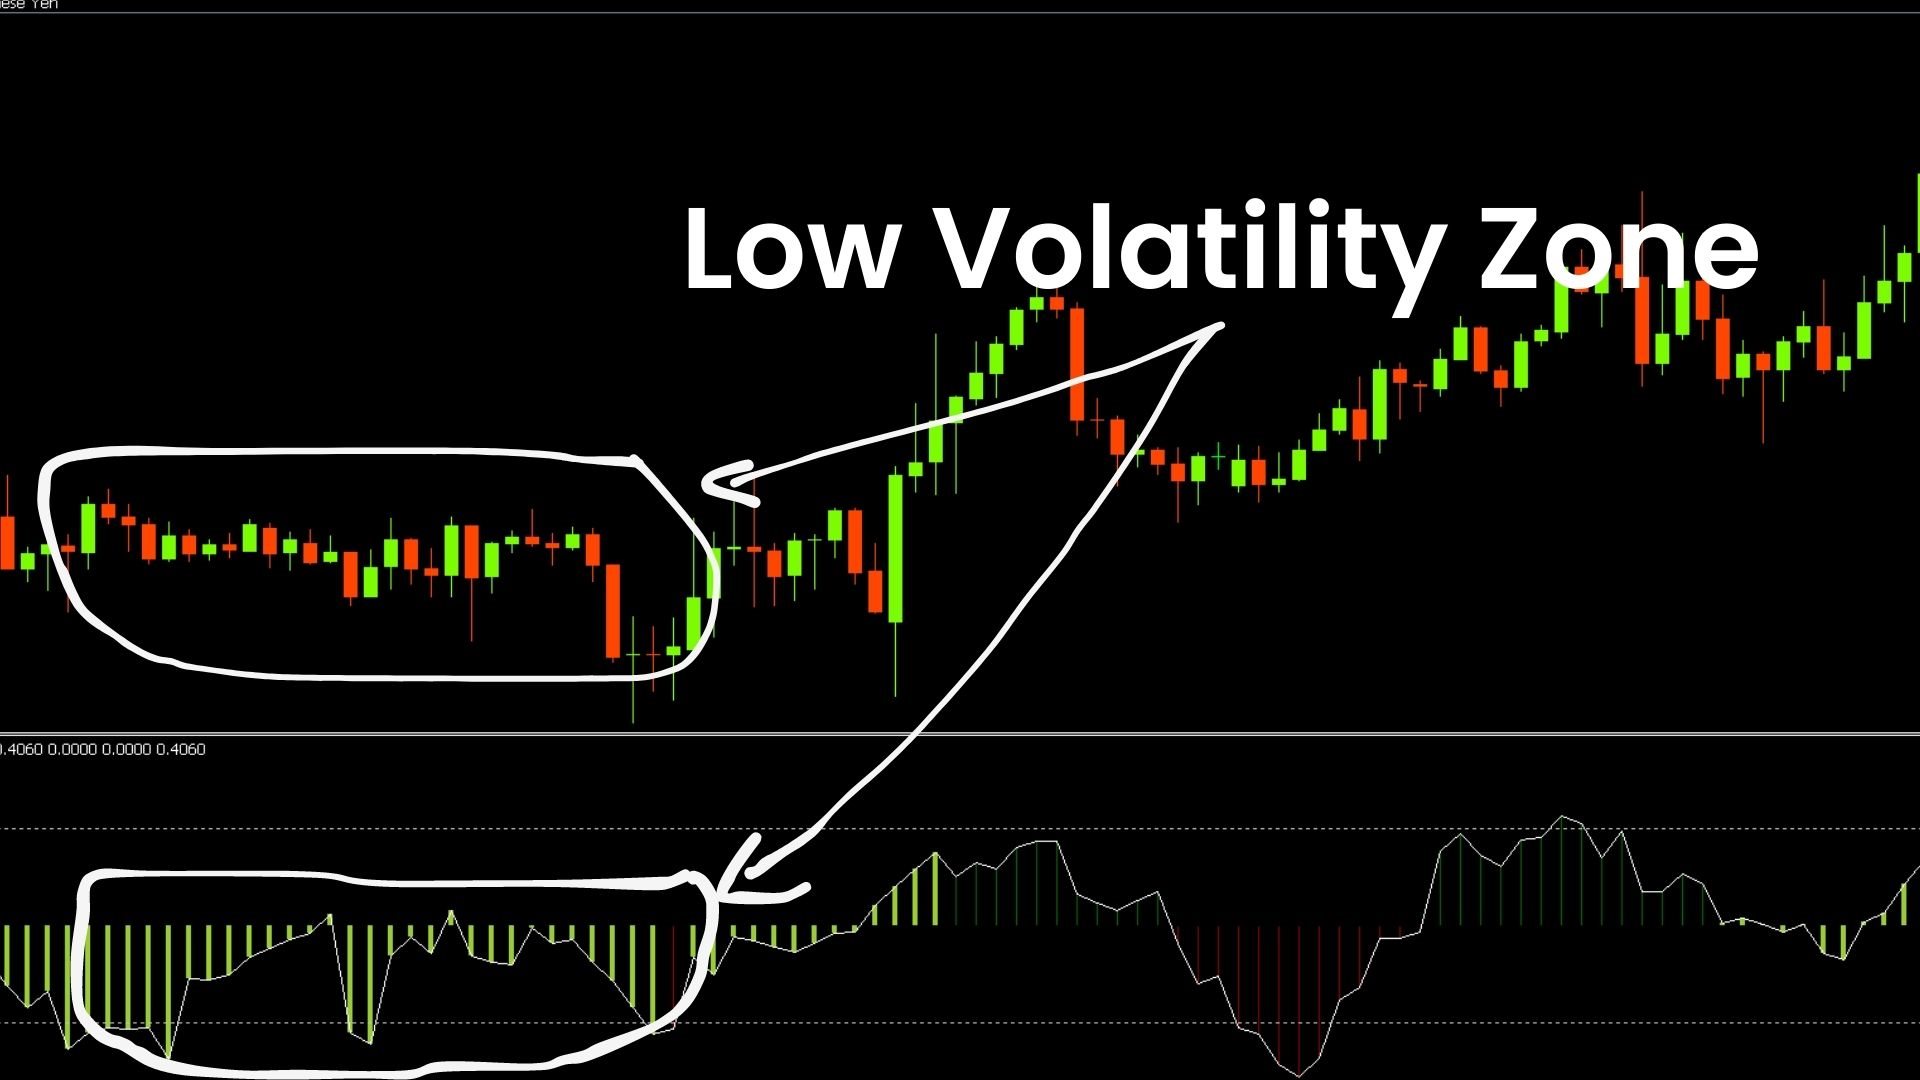
L'analizzatore di volatilità è un indicatore di momentum, che sfrutta la tendenza del prezzo a scoppiare fortemente dopo essersi consolidato in un range di trading ristretto. L'indicatore utilizza anche un oscillatore del momentum per mostrare la direzione prevista della mossa quando scatta la compressione. Questo istogramma oscilla attorno alla linea dello zero, l'aumento dello slancio al di sopra della linea dello zero indica un'opportunità di acquistare long, mentre lo slancio che scende al di sotto della linea dello zero può indicare un'opportunità di shorting.
OFFERTA A TEMPO LIMITATO: L'indicatore è disponibile per soli 50 $ e per tutta la vita. (Prezzo originale 125$)
Caratteristiche principali
- Rilevatore di tendenza laterale.
- Rilevatore di bassa volatilità.
- Rilevatori di alta volatilità rialzista e ribassista.
- Lavorare con tutti i tempi e tutte le coppie.
- Fornisci avvisi pop-up e avvisi di notifica push.
Contatto
Se hai qualche domanda o se hai bisogno di aiuto, contattami tramite messaggio privato.
Avvertimento
Tutti i nostri indicatori e strumenti sono disponibili solo tramite il Metatrader Store ufficiale (MQL5 Market).
Indicatori Premium
Accedendo al nostro profilo MQL5, puoi trovare tutti i nostri indicatori gratuiti e premium. Per accedere al nostro profilo, clicca qui.
Autore
SAYADI ACHREF, ingegnere del software fintech e fondatore di Finansya Lab.