Simple ATR modern
- Indicatori
- Pavel Bereznichenko
- Versione: 1.2
- Aggiornato: 26 agosto 2023
- Attivazioni: 10
Uno strumento semplificato per monitorare la volatilità del mercato con maggiore chiarezza, ideale sia per il day trading che per lo swing trading.
È il miglior indicatore per iniziare a fare trading o per i principianti.
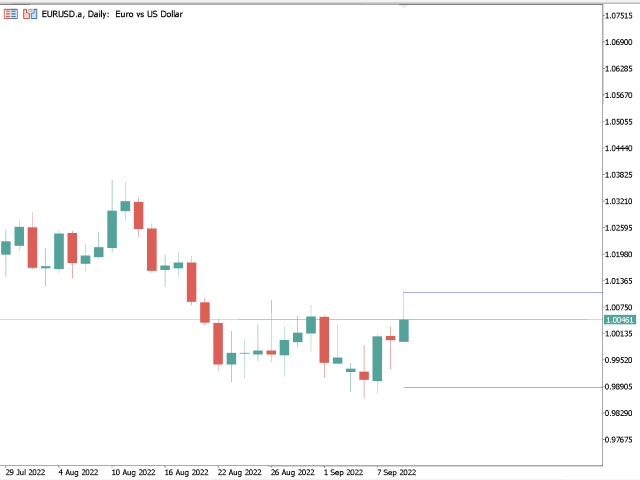
Colore dell'indicatore visivo: ATR Daily - Blu
Migliora l'analisi combinando con l'indicatore Volatility Vision.
Misura con precisione le fluttuazioni delle condizioni di mercato, essenziale per le decisioni sia nel day trading che nello swing trading.
Utilizza una semplice media mobile di 14 giorni (configurabile) degli indicatori di true range per garantire la precisione.
Ideale per implementare strategie di apertura o chiusura di posizioni nei sistemi di trading, massimizzando la redditività.
Perché gli indicatori ATR sono migliori degli altri:
Semplicità d'uso: Gli indicatori ATR sono facili da configurare e da comprendere, anche per i trader principianti.
Versatilità: Adatti sia per il day trading che per lo swing trading, offrendo flessibilità in diverse strategie di trading.
Affidabilità: L'ATR fornisce dati accurati sulla volatilità del mercato, aiutando i trader a prendere decisioni più informate.
Personalizzazione: La possibilità di regolare il periodo della media mobile consente ai trader di adattare l'indicatore alle proprie esigenze e preferenze specifiche.
Combinabilità: L'ATR si integra facilmente con altri indicatori, come il Volatility Vision, per un'analisi più approfondita delle condizioni di mercato.