UR Momenter
- Indicatori
- Krzysztof Jan Debski
- Versione: 1.10
- Aggiornato: 16 maggio 2024
- Attivazioni: 7
UR Momento
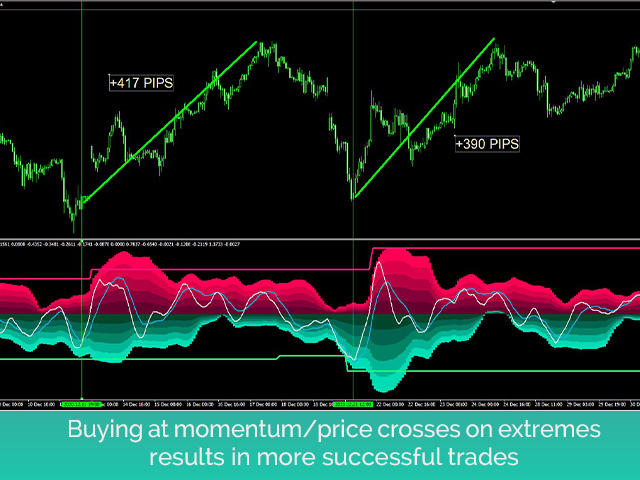
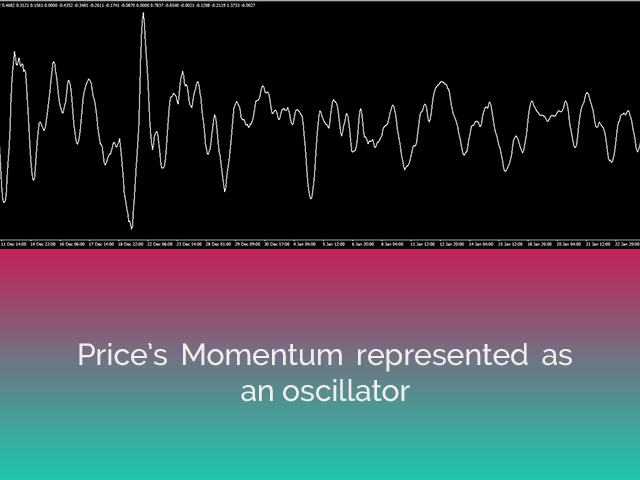
UR Momenter calcola perfettamente il momentum del prezzo in correlazione all'esaurimento del movimento del prezzo rappresentato come oscillatore. Pertanto questo ci dà segnali molto precoci di potenziali inversioni o ritracciamenti. Questa formula è stata scoperta nel 2018 dopo lo scoppio della bolla di mercato.
Vantaggi dell'utilizzo di UR Momenter:
Nessun parametro
Hai 2 linee che descrivono il movimento del prezzo - Linea bianca che è il Momentum del prezzo in correlazione alla deviazione media mobile del prezzo rappresentata come un oscillatore (linea blu)
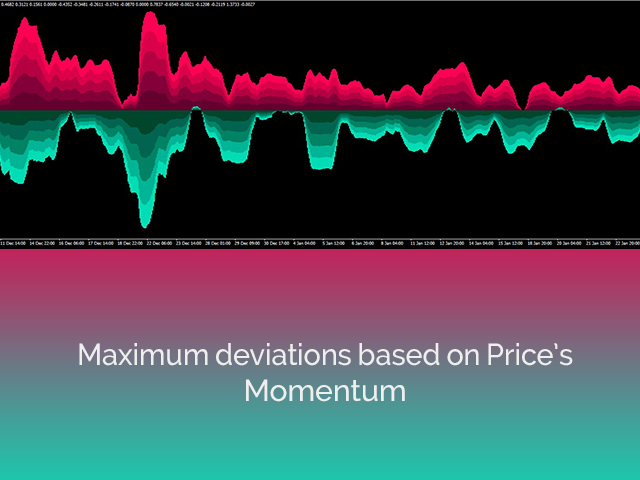
L'istogramma è una visualizzazione delle deviazioni massime nel contesto dello slancio del prezzo
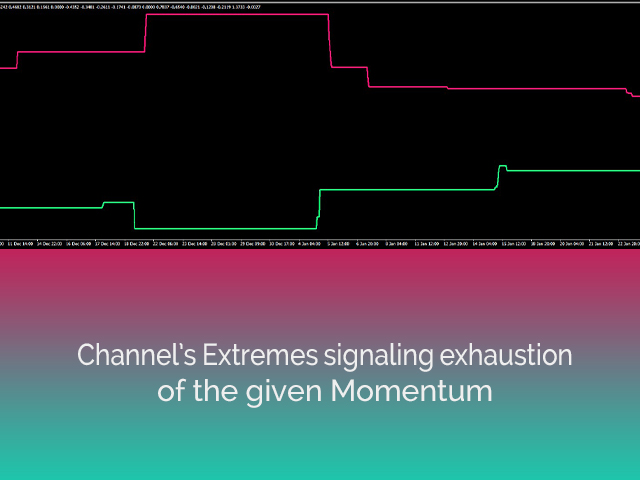
L'interfaccia mostra l'esaurimento di entrambe le linee su entrambi gli estremi (aree rosse superiori e aree verdi inferiori)
Il miglior vantaggio: facile e adattato a tutte le risorse.
C'è una speciale chat di Telegram su cui puoi rimanere aggiornato sugli aggiornamenti degli strumenti e anche inviare richieste se ritieni che manchi qualcosa!
Perché UR Momente?
Questo indicatore può essere utilizzato come indicatore autonomo, di ingresso o di uscita. A causa della sua dipendenza dal prezzo, può essere applicato a qualsiasi grafico e il suo algoritmo di calcolo delle deviazioni si basa su diversi anni di esperienza e osservazione.
Come usare UR Momenter?
Vedi la descrizione qui sotto per avere più familiarità con esso:
IMPOSTAZIONI
Nessuno
SCHERMO
Price Average Main Line (bianco): la quantità di moto del prezzo
Price Oscillator (blu): deviazione del prezzo rispetto alla sua media mobile.
Istogramma: mostra la deviazione della quantità di moto.
Aree estreme: aree in cui il prezzo si esaurirà e potenzialmente si invertirà.
AGGIUNTA
Tutti i miei strumenti funzionano meglio una volta assemblati. Ciò significa che la precisione dei punti di ingresso è decisamente migliore se utilizzata con UR DivergenceSpotter, UR VolumeTrend, UR Highs&Lows o/e UR TrendExhaustion.