• Panoramica
  • Recensioni (1)
  • Commenti

Draw by Hand Tool

5

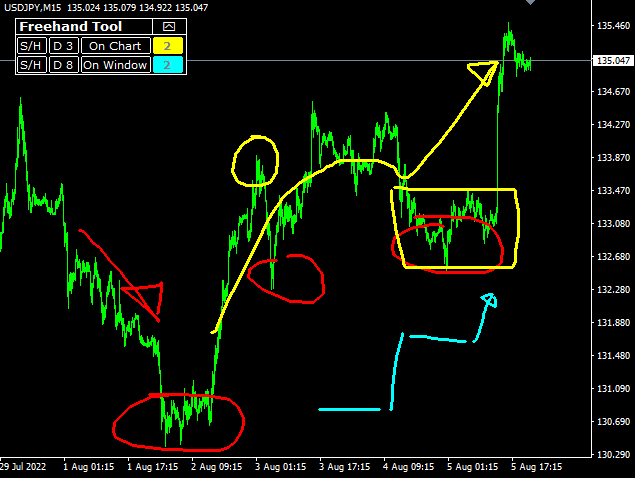
This tool provides a freehand drawing method, to treat the chart space as a blackboard and draw by-hand.

Drawings can be made to stick to the CHART (moves with chart scroll), or to stick to the WINDOW (does not move with chart scroll).

Features:

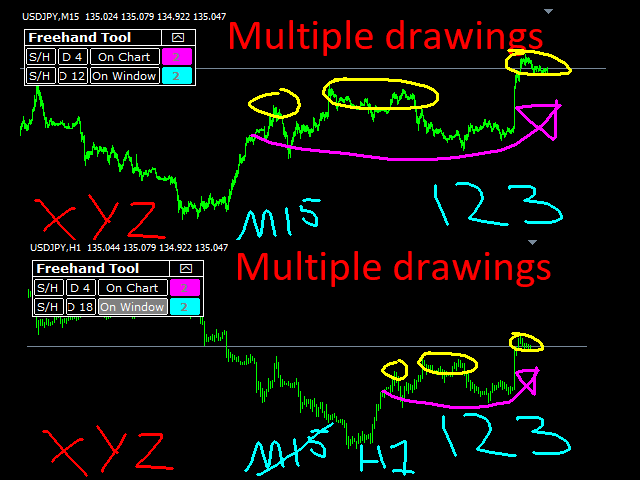
  • all drawings are individually styled, color, width
  • show/hide each drawing type
  • delete last drawing
  • drawings, on chart and on window, remain through TF changes and terminal re-starts, until the indicator is removed
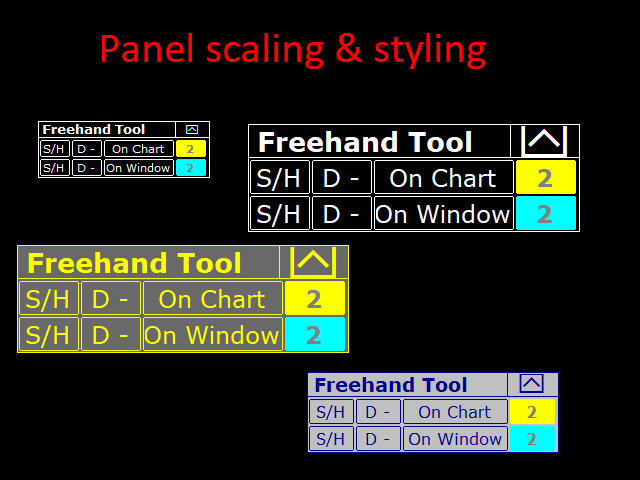
Panel:

  • stylable colors
  • scalable in size and font
  • movable
  • can be minimized

Recensioni 1
C V
23
C V 2023.03.15 21:35 
 

This is a great tool. Thank you. $50 well spent.

Prodotti consigliati
Trend Ray
Andriy Sydoruk
The indicator shows the potential trend direction by cyclical-wave dependence. Thus, all the rays of the intersection will be optimal rays, in the direction of which the price is expected to move, taking into account the indicator period. Rays can be used as a direction for potential market movement. But we must not forget that the approach must be comprehensive, the indicator signals require additional information to enter the market.
Fractals AM
Andriy Matviyevs'kyy
Classic indicator. The Fractals indicator analyzes the price patterns that form on the candlestick chart and display the reversal points of the market trend. The indicator consists of candles, the middle of which is either the highest (up fractal) or the lowest (down fractal). Highs and lows, indicated by the indicator on the chart, are recommended to be taken as points that form support and resistance lines. Unlike the original indicator, where fractals are formed by five candles (high/low in t
FREE
This is a trend-tracking indicator that determines the change in trend through changes in color. It can capture the big trend market and assist trend traders to enter and hold positions. A small rebound in the market will be filtered until the end of the trend. In the turbulent market, the horizontal line in the indicator can also be used as a support or pressure reference. More EA&Indicators click here https://www.mql5.com/en/users/chenshaofei/seller parameter Period - indicator period (large s
Magic Balance
Daniil Evstratenko
The indicator shows which trading pairs, strategies, robots and signals that you use are profitable and which are not. The statistic of trades and balance graph are displayed in the account currency and pips - to switch simply click on the graph. button "$"(top left) - minimize/expand and move the indicator panel button ">"(bottom right) - stretching and resetting to the original size Statistic of trades 1 line - account balance, current profit and lot of open trades; 2 line - the number of al
The SafeProfit Market Profile is the most advanced tracking indicator in the Forex Market. It was developed to track the market profile of each session of the day: Asian, European and American. With this indicator you will operate Intraday smiling ... knowing exactly where the Big Players are positioned and the exact moment where they are going to. The indicator is simple, fast and objective, tracking every movement of the Big Players in price. Get out of the 95% statistic that only loses and us
Unique Trend
Andriy Sydoruk
The Unique Trend indicator tracks market trends, ignoring sharp fluctuations and market noise. The indicator is suitable for trading on small timeframes because it ignores sudden price jumps or price corrections due to the reduction of market noise around the average price. The scan at minima and maxima forms the internal boundaries (channel) when calculating the indicator signals. The channel allows you to remove market noise. iMA and iATR are used to generate signals using the author's algo
What are Fibonacci Numbers and Lines? Fibonacci numbers are used to create technical indicators using a mathematical sequence developed by the Italian mathematician, commonly referred to as "Fibonacci," in the 13th century. The sequence of numbers, starting with zero and one, is created by adding the previous two numbers. For example, the early part of the sequence is 0, 1, 1, 2, 3, 5, 8, 13, 21, 34, 55, 89,144, 233, 377, and so on. The Fibonacci sequence is significant because of the so-call
Superindicadorok
Gretson Jose Salgado Hernandez
The easiest indicator to know to which address the price is MOVED: taking into account other indicators to measure the exact price direction more accurately and with less noise.  it is useful to know when to perform a BUY  operation one from SELL                                                                                                                                                                                                                                                             
Black dragon indicator
Ramil Minniakhmetov
4.87 (134)
L'indicatore di rilevamento delle tendenze integrerà qualsiasi strategia e può anche essere utilizzato come strumento indipendente. IMPORTANTE! Contattami subito dopo l'acquisto per ricevere istruzioni e un bonus! Raccomandazioni per lavorare con l'indicatore, puoi scaricare nel commento n Vantaggi Facile da usare, non sovraccarica il grafico con informazioni non necessarie; Possibilità di utilizzo come filtro per qualsiasi strategia; Ha livelli integrati di supporto e resistenza dinami
Prophet
Andriy Sydoruk
Prophet is a trend indicator. Shows the direction of turning points. Can be used with an optimal risk-to-profit ratio. The arrows indicate favorable moments and directions for entering the market. Uses one parameter for setting (adjust from 1 to 3). The probability of a successful trend is very high. In the course of work, the take-profit is much larger than the stop-loss! Works on all currency pairs and on all timeframes.
Legend Trend
Andriy Sydoruk
The intelligent algorithm of the Legend Trend indicator accurately shows the points of potential market reversal. The indicator tracks the market trend, ignoring sharp market fluctuations and noise around the average price. Implements a kind of technical analysis based on the idea that the market is cyclical in nature. This is a pointer indicator. It catches the trend and shows favorable moments of entering the market with arrows. A strategy for trading with the trend, filtering market noise
ZeroPoint
Andriy Sydoruk
ZeroPoint signals a change in the moving average angle, the LevelZero parameter sets the zero point circle, there are limits from -LevelZero to LevelZero including will be considered the zero point, it can be indicated in red on the histogram. Options:   LevelZero - zero point [-LevelZero, LevelZero];   Length - the length of the moving average;   Start - the starting point for calculating the angle;   End - is the end point for calculating the angle;   MetodMA - averaging method;   AppliedPri
Price Line
Nikolay Likhovid
5 (1)
High, Low, Open, Close — isn't this too much? Sometimes you need a unique history of prices. But if choose one thing, you lose the rest. Smoothing also leads to data loss. Often you lose one of the most important market details: information about extremes. It is due to the preservation of information about the highs and lows, the correct "smoothing" for the history of price is a zigzag. But zigzags also have drawbacks — they do not provide intermediate values. The Price Line indicator solves thi
FREE
LordChannel
Igor Pereira Calil
LordChannel is an indicator for META TRADER 4 for all forex pairs and financial market metals. The indicator is used to make detections of high/low channels, implementing a technical analysis on possible breakouts and making correct order entries. LordChannel sends signals such as buy and sell in the graphical analysis, it is important to emphasize that the importance of these signals are safe in TIME FRAMES M30, H1, H4. The indicator was created for using bullish/downtrend channels to co
The indicator,   Support and Resistance Detect Signal   automatically detects support and resistance levels and trend lines, emitting a signal whenever the condition is met, as configured. It reads support and resistance drawn manually or automatically built into the chart by other external indicators. Note:   Support and Resistance Detect Signal   is compatible with almost all external indicators that draw on the chart, support and resistance levels, in addition to trend lines. Discover
Nice Trade Point
Muhammed Emin Ugur
This    Nice Trade Point     indicator is designed for signal trading. This indicator generates trend signals. It uses many algorithms and indicators to generate this signal. It tries to generate a signal from the points with the highest trend potential. This indicator is a complete trading product. This indicator does not need any additional indicators. The indicator certainly does not repaint. The point at which the signal is given does not change.     Features and Suggestions Time
The principle of constructing indicator lines and their meaning .               The Signal Channel   indicator uses a robust filtering method based on two moving medians applicable to the High and Low prices, i.e. the lines <High> and <Low>, where <..> is the sign of linear averaging, which are shifted by certain values ​​in an uptrend and by opposite values ​​in a downtrend, which allows you to get a narrow channel, approximately outlining each bar. Sharp kinks of the lines of such a channel a
CorrelationUSD is a basic indicator, which is located on the chart. This tool allows you to monitor the relationship between assets, it reliably determines the patterns of quotation changes of one relative other asset. What is the indicator? All basic assets are interconnected, first of all, by a full complex of essential fundamental factors. For example, most currency pairs have a strong influence on measurements of each other’s quotes. Trends of this kind create macroeconomic news.
Mastodon
Yvan Musatov
Mastodon - displays potential market entry points. According to the wave theory, Mastodon displays the course of a large wave, while the oscillator can specify the entry point, that is, catch the price movement inside it, i.e. small “subwaves”. By correctly understanding the wave nature of price movements and using the Mastodon indicator in conjunction with an oscillator, you can create your own trading system, for example, entering the market after a large wave has formed and then exiting wh
Reversal Trend indicator, which recalculates values ​​for a new period without changing the previous ones. According to statistics, more than 85% of traders who prefer aggressive trading suffer losses. The rush and desire to make a profit immediately leads them to frequently open orders at random, much like playing in a casino. The bottom line is disappointing: a few trades, possibly, will bring profits and then losses. To understand the dynamics of the market and use it for profit, you need to
DMS Fibo
Diogo Mitsunaga Dos Santos
Fibonacci retracements are trend lines drawn between two significant points, usually between absolute lows and absolute highs, plotted on a chart. Intersecting horizontal lines are placed at the Fibonacci levels. Fibonacci retracements are useful tools that help traders identify support and resistance levels. With the information gathered, they can place orders, identify stop-loss levels, and set price targets. Although useful, traders often use other indicators to make more accurate assessments
Rediscover how fractals can transform your trading This is a very simple yet effective indicator to trade breakouts of variable fractal periods. A fractal is a price formation of an odd number of bars, being the middle bar the highest or lowest price point of the formation. These prices act as short-term support and resistance levels, which this indicator uses to draw a price channel and display breakouts. [ Installation Guide | Update Guide | Troubleshooting | FAQ | All Products ] Easy to trad
Introduction "Smart money" is money invested by knowledgeable individuals at the right time, and this investment can yield the highest returns. The concept we focus on in this indicator is whether the market is in an uptrend or downtrend. The market briefly takes a weak and reversal trend with "Minor BoS" without being able to break the major pivot. In the next step, it returns to its main trend with a strong bullish move and continues its trend with a "Major BoS". The "order bloc
The indicator displays the moving average of all periods on one chart. It shows the MA of a one step lower timeframe and all the MAs equal to and higher than it. Parameters Period moving average - Moving Average period (default is 34); Used to calculate price - price used for the MA calculation (default is the average price = (high+low)/2); The averaging method - default is linear-weighted; Moving average shift - MA shift (default is 0). Just enter the MA calculation period and its parameters,
Introduction It is common practice for professional trades to hide their stop loss / take profit from their brokers. Either from keeping their strategy to the themselves or from the fear that their broker works against them. Using this indicator, the stop loss / take profit points will be drawn on the product chart using the bid price. So, you can see exactly when the price is hit and close it manually.  Usage Once attached to the chart, the indicator scans the open orders to attach lines fo
Tin
Maryna Shulzhenko
The Tin indicator is designed to visually display the current trend in the market. One of the key aspects of foreign exchange market analysis is to determine the trend, which is the sustainable direction of price movement. To do this, the Tin indicator uses algorithms that smooth out sharp fluctuations that do not have a significant impact on the overall trend. A trend can be either upward (bullish) or downward (bearish). Typically, a trend persists for a long time before abruptly changing di
Ind Dochian Chanel mt4
Mauricio Valbuena
5 (3)
The Donchian channel is an indicator that takes a series of user-defined periods and calculates the upper and lower bands. Draw two lines on the graph according to the Donchian channel formula. This straightforward formula is based on: The top line is the highest price for the last periods n The bottom line is the lowest price for the last periods n Trend systems follow periods when support and resistance levels are broken. in this case when the price breaks the upper line or the lower line
FREE
SuperRSI
Andriy Sydoruk
The SuperRSI indicator is an advanced index of internal strength. The indicator shows not the relative strength of the trading instruments being compared, but the internal strength of a single instrument, therefore, it is the “Internal Strength Index”. This is an advanced form of the SuperRSI indicator. It converts the signal so that low-frequency components are delayed much more than high-frequency components. In general, the data of the last bar have more weight than previous data, like an exp
Going straight
Maryna Shulzhenko
American traders say: “Trend is your friend”, which means “Trend is your friend”. And indeed it is! By trading with the trend, you reduce your risks and gain an advantage, as you increase the mathematical expectation of completed trades and, therefore, earn more profit. Together with the Going straight indicator you will trade with the trend with ease! This is one of the most effective ways to deal with market trends. Trading strategies using the channel indicator belong to the classic method
The resistance and support lines are the position where the price will have a change, be it a breakout to follow the trend or reverse. The price rule will go from support to resistance and Long's resistance can be Short's support and the opposite is true. Accurately identifying support and resistance lines is the key to being able to trade well and profitably. This indicator is based on the Fractals indicator, the indicator will be redrawn by 2 candles. *Great For Swing Trading *Blue is Support
Gli utenti di questo prodotto hanno anche acquistato
Gann Made Easy
Oleg Rodin
4.88 (100)
Gann Made Easy è un sistema di trading Forex professionale e facile da usare che si basa sui migliori principi del trading utilizzando la teoria di mr. WD Gann. L'indicatore fornisce segnali ACQUISTA e VENDI accurati, inclusi i livelli di Stop Loss e Take Profit. Puoi fare trading anche in movimento utilizzando le notifiche PUSH. Vi prego di contattarmi dopo l'acquisto! Condividerò i miei consigli di trading con te e fantastici indicatori bonus gratuitamente! Probabilmente hai già sentito parlar
Gold Stuff
Vasiliy Strukov
4.9 (270)
Gold Stuff è un indicatore di tendenza progettato specificamente per l'oro e può essere utilizzato anche su qualsiasi strumento finanziario. L'indicatore non ridisegna e non è in ritardo. Periodo consigliato H1. Su di esso l'indicatore funziona in modo completamente automatico Expert Advisor EA Gold Stuff. Lo trovi nel mio profilo. I risultati in tempo reale possono essere visualizzati qui.  Puoi ottenere una copia gratuita del nostro indicatore Strong Support e Trend Scanner, per favore scri
Trend Punch
Mohamed Hassan
4.91 (23)
This indicator is unstoppable when combined with our other indicator called  Support & Resistance . After purchase, send us a message and you will get it   for  FREE as a BONUS! Introducing Trend Punch , the revolutionary forex trend indicator that will transform the way you trade! Trend Punch is uniquely designed to provide precise buy and sell arrows during strong market trends, making your trading decisions clearer and more confident. Whether you're trading major currency pairs or exotic sym
SI PREGA DI LEGGERE LE INFORMAZIONI QUI SOTTO PRIMA DI ACQUISTARE IL PRODOTTO! Apollo Pips PLUS SP è un prodotto unico! È PER CHI VUOLE OTTENERE IL MIO NUOVO INDICATORE "APOLLO PIPS" PIÙ IL BONUS "SUPER PACK" CON ACCESSO A TUTTI I MIEI INDICATORI DI TRADING! Acquistando il prodotto Apollo Pips PLUS SP stai effettivamente acquistando una versione assolutamente nuova del mio indicatore Apollo Pips. Questa versione dell'indicatore ha un algoritmo migliorato e un parametro facile da usare che ti dà
Scalper Inside PRO
Alexey Minkov
4.75 (60)
An exclusive indicator that utilizes an innovative algorithm to swiftly and accurately determine the market trend. The indicator automatically calculates opening, closing, and profit levels, providing detailed trading statistics. With these features, you can choose the most appropriate trading instrument for the current market conditions. Additionally, you can easily integrate your own arrow indicators into Scalper Inside Pro to quickly evaluate their statistics and profitability. Scalper Inside
Trend Pulse
Mohamed Hassan
5 (5)
Please contact me after purchase to immediately get your PDF strategy + documentation for Trend Pulse !  Official release price of $89  (2 /50 copies left). Next price is $199 . Introducing Trend Pulse , a unique and robust indicator capable of detecting bullish, bearish, and even ranging trends! Trend Pulse uses a special algorithm to filter out market noise with real precision. If the current symbol is moving sideways, Trend Pulse will send you a ranging signal, letting you know that it'
FX Power MT4 NG
Daniel Stein
5 (13)
Ricevi il tuo aggiornamento quotidiano sul mercato con dettagli e schermate tramite il nostro Morning Briefing qui su mql5 e su Telegram ! FX Power MT4 NG è la nuova generazione del nostro popolare misuratore di forza delle valute, FX Power. Cosa offre questo misuratore di forza di nuova generazione? Tutto ciò che avete amato dell'FX Power originale IN PIÙ Analisi della forza di ORO/XAU Risultati di calcolo ancora più precisi Periodi di analisi configurabili individualmente Limite di calcolo pe
TPSproTREND PrO
Roman Podpora
4.79 (19)
TPSpro TREND PRO   è un indicatore di tendenza che analizza automaticamente il mercato, fornisce informazioni sulla tendenza e sui rispettivi cambiamenti e fornisce segnali per entrare nelle operazioni senza ridisegnare. L'indicatore utilizza ciascuna candela e la analizza separatamente. Si riferisce a vari shock al rialzo o al ribasso. Punto di ingresso preciso per il trading di valute, criptovalute, metalli, azioni e indici! Versione MT5                   Descrizione completa dell'indicatore
Atomic Analyst
Issam Kassas
5 (3)
Innanzitutto, vale la pena sottolineare che questo indicatore di trading non è repaint, non è ridisegno e non presenta ritardi, il che lo rende ideale sia per il trading manuale che per quello automatico. Manuale utente: impostazioni, input e strategia. L'Analista Atomico è un indicatore di azione del prezzo PA che utilizza la forza e il momentum del prezzo per trovare un miglior vantaggio sul mercato. Dotato di filtri avanzati che aiutano a rimuovere rumori e segnali falsi, e aumentare il pote
Gold Channel is a volatility-based indicator, developed with a specific timing algorithm for the XAUUSD pair, which consists of finding possible corrections in the market. This indicator shows two outer lines, an inner line (retracement line) and an arrow sign, where the theory of the channel is to help identify overbought and oversold conditions in the market. The market price will generally fall between the boundaries of the channel. If prices touch or move outside the channel it is a tra
Currency Strength Wizard è un indicatore molto potente che ti fornisce una soluzione all-in-one per un trading di successo. L'indicatore calcola la potenza di questa o quella coppia forex utilizzando i dati di tutte le valute su più intervalli di tempo. Questi dati sono rappresentati in una forma di indice di valuta facile da usare e linee elettriche di valuta che puoi utilizzare per vedere il potere di questa o quella valuta. Tutto ciò di cui hai bisogno è collegare l'indicatore al grafico che
Attualmente 20% di sconto! La soluzione migliore per ogni principiante o trader esperto! Questo software per cruscotti funziona su 28 coppie di valute. Si basa su 2 dei nostri indicatori principali (Advanced Currency Strength 28 e Advanced Currency Impulse). Offre un'ottima panoramica dell'intero mercato Forex. Mostra i valori di forza delle valute avanzate, la velocità di movimento delle valute e i segnali per 28 coppie Forex in tutti i (9) timeframe. Immaginate come migliorerà il vostro t
PZ Day Trading
PZ TRADING SLU
3.67 (3)
Effortless trading: non-repainting indicator for accurate price reversals Special Offer: Purchase now to receive free bonuses worth $189! (Read more for details) This indicator detects price reversals in a zig-zag fashion, using only price action analysis and a donchian channel. It has been specifically designed for short-term trading, without repainting or backpainting at all. It is a fantastic tool for shrewd traders aiming to increase the timing of their operations. [ Installation Guide | Up
Clear Breakout
Martin Alejandro Bamonte
5 (1)
L'indicatore "Breakout Buy-Sell" è progettato per identificare e evidenziare potenziali opportunità di acquisto e vendita basate su breakout di prezzo durante diverse sessioni di mercato (Tokyo, Londra e New York). Questo indicatore aiuta i trader a visualizzare chiaramente le zone di acquisto e vendita, nonché i livelli di take-profit (TP) e stop-loss (SL). Strategia di utilizzo L'indicatore può essere utilizzato come segue: Impostazione iniziale : Seleziona la sessione di mercato e regola il G
ATTUALMENTE SCONTATO DEL 26% La soluzione migliore per ogni principiante o trader esperto! Questo indicatore è uno strumento di trading unico, di alta qualità e conveniente perché abbiamo incorporato una serie di caratteristiche proprietarie e una nuova formula. Con un solo grafico è possibile leggere la forza delle valute per 28 coppie Forex! Immaginate come migliorerà il vostro trading perché sarete in grado di individuare l'esatto punto di innesco di una nuova tendenza o di un'opportunit
PRO Renko System
Oleg Rodin
5 (26)
PRO Renko System è un sistema di trading altamente accurato appositamente progettato per il trading di grafici RENKO. Questo è un sistema universale che può essere applicato a vari strumenti di trading. Il sistema neutralizza efficacemente il cosiddetto rumore di mercato che consente di accedere a segnali di inversione accurati. L'indicatore è molto facile da usare e ha un solo parametro responsabile della generazione del segnale. Puoi facilmente adattare lo strumento a qualsiasi strumento
Innanzitutto, vale la pena sottolineare che questo Strumento di Trading è un Indicatore Non-Ridipingente, Non-Ridisegnante e Non-Laggante, il che lo rende ideale per il trading professionale. Corso online, manuale utente e demo. L'Indicatore Smart Price Action Concepts è uno strumento molto potente sia per i nuovi che per i trader esperti. Racchiude più di 20 utili indicatori in uno solo, combinando idee di trading avanzate come l'Analisi del Trader del Circolo Interno e le Strategie di Trading
Advanced Currency IMPULSE with ALERT
Bernhard Schweigert
4.91 (495)
ATTUALMENTE SCONTATO DEL 31%! La soluzione migliore per ogni principiante o trader esperto! Questo indicatore è uno strumento di trading unico, di alta qualità e conveniente perché abbiamo incorporato una serie di caratteristiche proprietarie e una formula segreta. Con un solo grafico fornisce avvisi per tutte le 28 coppie di valute. Immaginate come migliorerà il vostro trading perché sarete in grado di individuare l'esatto punto di innesco di una nuova tendenza o opportunità di scalping!
Advanced Supply Demand
Bernhard Schweigert
4.9 (314)
CURRENTLY 26% OFF !! Best Solution for any Newbie or Expert Trader! This indicator is a unique, high quality and affordable trading tool because we have incorporated a number of proprietary features and a new formula. With this update, you will be able to show double timeframe zones. You will not only be able to show a higher TF but to show both, the chart TF, PLUS the higher TF: SHOWING NESTED ZONES. All Supply Demand traders will love it. :) Important Information Revealed Maximize the potenti
NAM Order Blocks
NAM TECH GROUP, CORP.
5 (1)
MT4 Multi-timeframe Order Blocks detection indicator. Features - Fully customizable on chart control panel, provides complete interaction. - Hide and show control panel wherever you want. - Detect OBs on multiple timeframes. - Select OBs quantity to display. - Different OBs user interface. - Different filters on OBs. - OB proximity alert. - ADR High and Low lines. - Notification service (Screen alerts | Push notifications). Summary Order block is a market behavior that indicates order collection
Enigmera
Ivan Stefanov
5 (4)
ENIGMERA: Il cuore del mercato https://www.enigmera.com Introduzione Questo indicatore e sistema di trading rappresenta un approccio straordinario ai mercati finanziari. ENIGMERA utilizza i cicli frattali per calcolare con precisione i livelli di supporto e resistenza. Mostra l'autentica fase di accumulazione e fornisce direzione e obiettivi.  Un sistema che funziona sia in un trend che in una correzione.  Come funziona? ENIGMERA è composto da tre linee: la linea di supporto/resistenza, la
PZ Trend Trading
PZ TRADING SLU
4.8 (5)
Capture every opportunity: your go-to indicator for profitable trend trading Special Offer: Purchase now to receive free bonuses worth $159! (Read more for details) Trend Trading is an indicator designed to profit as much as possible from trends taking place in the market, by timing pullbacks and breakouts. It finds trading opportunities by analyzing what the price is doing during established trends. [ Installation Guide | Update Guide | Troubleshooting | FAQ | All Products ] Trade financial
TPSpro RFI Levels
Roman Podpora
4.83 (24)
Inverti il primo livello di impulso (RFI)       istruire       Russia       -        ESP   Raccomandazione di utilizzare   l'indicatore -   TPSpro   Trend Edizione Professional -Versione   MT5 La cosa più importante nel comercio son è la cosa più importante in futuro. La cosa più importante è la cosa più importante. Funzioni principali: La maggior parte delle zone sono attivate da venditori e compradores! Indicador mostra tutti i livelli/zone dei primi impulsi corretti per acquisti e vendite. LO
Scalper Vault
Oleg Rodin
5 (29)
Scalper Vault è un sistema di scalping professionale che ti fornisce tutto il necessario per scalping di successo. Questo indicatore è un sistema di trading completo che può essere utilizzato dai trader di forex e opzioni binarie. L'intervallo di tempo consigliato è M5. Il sistema fornisce segnali di freccia accurati nella direzione della tendenza. Ti fornisce anche i segnali più alti e più bassi e i livelli di mercato di Gann. Gli indicatori forniscono tutti i tipi di avvisi, comprese le notifi
M1 Arrow
Oleg Rodin
4.73 (15)
Una strategia intraday basata su due principi fondamentali del mercato. L'algoritmo si basa sull'analisi dei volumi e delle onde di prezzo utilizzando filtri aggiuntivi. L'algoritmo intelligente dell'indicatore fornisce un segnale solo quando due fattori di mercato si combinano in uno solo. L'indicatore calcola le onde di un certo intervallo sul grafico M1 utilizzando i dati dell'intervallo di tempo più alto. E per confermare l'onda, l'indicatore utilizza l'analisi per volume. Questo indicatore
Order Block Hunter
Noha Mohamed Fathy Younes Badr
5 (2)
Order block hunter indicator is the best indicator for  hunt the order blocks that area where there has been a large concentration of limit orders waiting to be executed Order blocks are identified on a chart by observing previous price action and looking for areas where the price experienced significant movement or sudden changes in direction .This indicator does that for you by using very complicated codes and helps you to take the best areas To buy and sell because it make marks at the best a
Backtest and Read Overview before purchase. Chart patterns have been a topic of debate among traders; some believe they are reliable signalers, while others do not. Our Chart Patterns All-in-One indicator displays various chart patterns to help you test these theories for yourself. The profitability of these patterns is not a reflection of the indicator's effectiveness but rather an evaluation of the patterns themselves. The Chart Patterns All-in-One indicator is an excellent tool for visualizin
Break and Retest
Mohamed Hassan
4.17 (18)
This Indicator only places quality trades when the market is really in your favor with a clear break and retest. Patience is key with this price action strategy! If you want more alert signals per day, you increase the number next to the parameter called: Support & Resistance Sensitivity.  After many months of hard work and dedication, we are extremely proud to present you our  Break and Retest price action indicator created from scratch. One of the most complex indicators that we made with ove
AW Trend Predictor
AW Trading Software Limited
4.74 (39)
La combinazione di trend e livelli di rottura in un unico sistema. Un algoritmo di indicatore avanzato filtra il rumore del mercato, determina la tendenza, i punti di ingresso e i possibili livelli di uscita. I segnali indicatori sono registrati in un modulo statistico, che permette di selezionare gli strumenti più adatti, mostrando l'efficacia dello storico dei segnali. L'indicatore calcola i segni Take Profit e Stop Loss. Manuale e istruzioni ->   Qui   / Versione MT5 ->   Qui Come fare tradi
AVVISO DI ACQUISTO E VENDITA MULTIVALUTA e MULTITIMEFRAME. AUTO TAILING STOP E RISCHIO PREMIO TAKEPROFIT! L'INDICATORE SCANSIONA E ANALIZZA IL MERCATO COSÌ NON HAI NULLA DA FARE! SCAMBIA TUTTE LE TUE VALUTE SU 1 TABELLA!   Dopo l'acquisto lascia un commento contattami e ti invierò l'assistente commerciale EA. L'indicatore utilizza diversi oscillatori e filtri allegati per trovare i migliori punti di ingresso CONFERMATI, quindi non devi preoccuparti di questo! Ti avviserà e disegnerà un pu
Altri dall’autore
RSI Color Candles with Moving Average
John Louis Fernando Diamante
4.75 (4)
See RSI values turned into colored candles This indicator provides both colored candles and a colored moving average. 6 drawaing styles are provided to allow customization of the color coding. Applying coding to the chart may help in conceptualizing price trend and impulse movements defined through RSI values. Features - optional colored candles - optional colored ma - 6 draw styles; RSI slope RSI above/below overbought/oversold levels RSI above/below level 50 RSI above/below it's moving aver
FREE
Shape Pack MT5
John Louis Fernando Diamante
This indicator provides common shapes as drawing object options. The shapes are rotatable, resizable, draggable, and will keep their proportions (according to their handle trendline) across different chart scales. Multiple drawings are supported. Shapes: Square Rhombus Triangle (quadrilateral & isosceles) Circle (grid, overlapped grid, flexi grid, rotatable grid, concentric circles) Features: rays (all object edges will be rays) show/hide each individual drawing type, or all delete last drawn
FREE
Mini Chart Multi
John Louis Fernando Diamante
5 (9)
This indicator tool provides mini charts, with adjustable symbol/tf that can be dragged into place. Lightweight operation with multiple mini charts are supported. Chart features: adjustable symbol and tf draggable multiple mini charts color styling and font sizing, foreground/background colors candle coloring candle styles; candles, bars, line, high-low channel zoom in/out
FREE
Symbol Overlay
John Louis Fernando Diamante
5 (2)
This indicator plots another symbol on the current chart. A different timeframe can be used for the symbol, with an option to display in multiple timeframe mode (1 overlay candle per several chart candles). Basic indicators are provided. To adjust scaling of prices from different symbols, the overlay prices are scaled to the visible chart price space. Features symbol and timeframe input MTF display option to vertically invert chart, eg overlay USDJPY, invert to show JPYUSD data window values
FREE
Bollinger Bands Max Free MT5
John Louis Fernando Diamante
5 (1)
A flexible BB indicator You're no longer limited to the built in default of using BB off a SMA method, now you can choose from: SMA - SMMA - EMA - LWMA - ADAPTIVE - FRACTAL ADAPTIVE - DEMA - TEMA - VARIABLE INDEX DYNAMIC You now also have 2 standard deviation levels. A more featured version is available with 5 deviation levels, color gradients to lines and filling as well as candles, with full alerts too: Bollinger Bands Max MT5 Options: - MTF - 9 choices of MA to base the BB off -  2 adjust
FREE
Heiken Ashi in Subwindow
John Louis Fernando Diamante
4.67 (3)
This indicator plots Heiken Ashi candles in a subwindow instead of the main chart, making it possible to analyse HA candles whilst keeping the main chart clean. - optional bid/close line is provided, stylable, updates on tick - HA candles are stylable via the inputs tab - optional price smoothing to the HA candles, with moving average period and method options - auto-scaling when scrolling back and forth
FREE
Larger Price Time Crosshair Data
John Louis Fernando Diamante
5 (3)
This utility indicator provides accessibility and readability, by displaying a larger price scale, time scale, crosshair, and symbol name/tf/ohlc information. All features are sizeable and can be styled separately, and are optional to show. All Features optional to use font, size and color options Price Scale option to hide the default MT4 price scale option to show horizontal lines at price levels prices drawn can be at round numbers (ie automatic rounding to multiples of 5/10/20/25 point
FREE
MACD Max Free
John Louis Fernando Diamante
5 (1)
A flexible 2-Line MACD indicator The default MACD indicator inside MT4, limits you to using the MACD with a fast-EMA, slow-EMA, and signal-SMA. This MACD indicator allows you to set your own MA-Method choices for these 3 components, separately! You can select from SMA-EMA-SMMA-LWMA, and can even use a separate method for each 3 fast-slow-signal periods. A more featured version is available with colored candles+conditions, full alerts+conditions, line coloring, DEMA and TEMA options; MACD MAX
FREE
Tick Speed Pro MT5
John Louis Fernando Diamante
Tick Speed Pro povides a charted record of tick speed to allow you to see the ebb and flow of market activity. Observing patterns in tick speed may allow you to better time entries to reduce slippage and re-quotes. The tick speed plot updates it's entire position to show you only the last N seconds you choose, ideal for scalping and HFT approaches. An alert is provided to signal when the instrument is getting ticks at a higher rate than the alert limit. Multiple loadings are supported to compar
MACD Max MT5
John Louis Fernando Diamante
A flexible 2-Line MACD indicator The default MACD indicator inside MT4, limits you to using the MACD with a fast-EMA, slow-EMA. This MACD indicator allows you to set your own MA-Method choices for these 2 components, separately! You can select from SMA, EMA, SMMA, LWMA, ADAPTIVE MA, FRACTAL MA, DEMA, TEMA, VARIABLE INDEX DYNAMIC MA, and can even use a separate method for each 2 fast-slow. The signal line has options from SMA-EMA-SMMA-LWMA. On-chart colored candles, with drawing condition types i
MACD Max
John Louis Fernando Diamante
A flexible 2-Line MACD indicator The default MACD indicator inside MT4, limits you to using the MACD with a fast-EMA, slow-EMA, and signal-SMA. This MACD indicator allows you to set your own MA-Method choices for these 3 components, separately! You can select from SMA-EMA-SMMA-LWMA-DEMA-TEMA, and can even use a separate method for each 3 fast-slow-signal periods. On-chart colored candles, with drawing condition types is included, with a show/hide button too. Features - MA Methods: SMA, EMA, S
Tick Speed Free MT5
John Louis Fernando Diamante
Tick Speed Free povides a on-chart label of tick speed to allow you to see the ebb and flow of market activity. Observing rises and falls in tick speed may allow you to better time entries to reduce slippage and re-quotes. Options include: - colores for low-mid-high tick speeds - placement and styling - prefix & suffix to customise the speed label Troubleshooting: - Note, in the tester environment, tick timings are limited to what is supplied by the tester environment and it's speed - If
FREE
Shape Pack
John Louis Fernando Diamante
This indicator provides common shapes as drawing object options. The shapes are rotatable, resizable, draggable, and will keep their proportions (according to their handle trendline) across different chart scales. Multiple drawings are supported. Shapes: Square Rhombus Triangle (quadrilateral & isosceles) Circle (grid, overlapped grid, flexi grid, rotatable grid, concentric circles) Features: rays (all object edges will be rays) show/hide each individual drawing type, or all delete last drawn
FREE
Bollinger Bands Max Free
John Louis Fernando Diamante
4.67 (3)
A BB indicator with MA options You're no longer limited to the built in default of using BB off a SMA method, now you can choose from SMA-EMA-SMMA-LWMA. You now also have up to 3 standard deviation levels, with price labels. Options: - MTF - moving average type SMA-EMA-SMMA-LWMA -  3 adjustable deviation levels - separate coloring to lines and texts Troubleshooting: - If there are any issues or suggestions for the indicator, please comment and let me know. The feedback will be noted and c
FREE
Market Ticker Free MT5
John Louis Fernando Diamante
5 (1)
A scrolling Market Ticker that displays price changes from all symbols in the Market Watch list. Provides an easy snapshot of symbol prices, and keeps scrolling automatically while you trade and analyse the chart. Options include: - MTF, eg choose to show price changes of the daily chart, or the hourly - use the live candle or the recently completed - font and background coloring
FREE
Tick Speed Free
John Louis Fernando Diamante
5 (1)
Tick Speed Free povides a on-chart label of tick speed to allow you to see the ebb and flow of market activity. Observing rises and falls in tick speed may allow you to better time entries to reduce slippage and re-quotes. Options include: - colores for low-mid-high tick speeds - placement and styling - prefix & suffix to customise the speed label Troubleshooting: - Note, in the tester environment, tick timings are limited to what is supplied by the tester environment and it's speed - If
FREE
Market Ticker Free
John Louis Fernando Diamante
5 (1)
A scrolling Market Ticker that displays price changes from all symbols in the Market Watch list. Provides an easy snapshot of symbol prices, and keeps scrolling automatically while you trade and analyse the chart. Options include: - MTF, eg choose to show price changes of the daily chart, or the hourly - use the live candle or the recently completed - font and background coloring
FREE
Market Ticker
John Louis Fernando Diamante
The only Market Ticker on the market! Add a professional novelty to your workspace, with built in mini-charts A scrolling Market Ticker that displays price changes from all symbols in the Market Watch list. Provides an easy snapshot of symbol prices, and keeps scrolling automatically while you trade and analyse the chart. The ticker color (+/- price changes) are based on either the current or completed candle, and the previous candle. Options include: - MTF, eg choose to show price changes
Tick Speed Pro
John Louis Fernando Diamante
Tick Speed Pro povides a charted record of tick speed to allow you to see the ebb and flow of market activity. Observing patterns in tick speed may allow you to better time entries to reduce slippage and re-quotes. The tick speed plot updates it's entire position to show you only the last N seconds you choose, ideal for scalping and HFT approaches. An alert is provided to signal when the instrument is getting ticks at a higher rate than the alert limit. Multiple loadings are supported to compar
Bollinger Bands Max
John Louis Fernando Diamante
5 (2)
A fully featured BB indicator You're no longer limited to the built in default of using BB off a SMA method, now you can choose from SMA - EMA - SMMA - LWMA - DEMA - TEMA. You now also have up to 5 standard deviation levels, with price labels, and deviation-colored candles are provided. Options: - MTF - moving average type SMA - EMA - SMMA - LWMA - DEMA - TEMA -  5 adjustable deviation levels - color gradients to BB lines, candles, and texts - show-hide button to declutter the chart - full a
Pivot Types with Levels MTF
John Louis Fernando Diamante
5 (2)
Fully featured Pivots and Levels indicator Pivots: Floor (normal), Woody, Camarilla, Fibonacci Levels: ATR, Historical Volatility with standard deviations, Close Price Volatility with standard deviations Features: 4 +/- levels MTF, pivots/levels based on Daily, Weekly, 4hr or even 15min Hour and minute time offset Texts with prices and pip distances to central pivot/level Inputs for Camarilla/Fibonacci/ATR/Volatility levels Alerts, popup, push, email, sound, live or completed candles on leve
Drawing Pack
John Louis Fernando Diamante
4 (1)
This indicator provides several drawing tools to assist in various methods of chart analysis. The drawings will keep their proportions (according to their handle trendline) across different chart scales, update in real time, and multiple drawings are supported. # Drawing Option Description  1 Grid box draggable boxed grid, user defines rows x colums, diagonal ray option  2 Grid partial or fullscreen grid, sized by handle line  3 Grid flex a diagonal grid, sized and sloped by handle line
Mini Chart
John Louis Fernando Diamante
This indicator tool provides mini charts, with adjustable symbol/tf that can be dragged and resized into place. Lightweight operation with multiple mini charts are supported. Chart features: adjustable symbol and tf draggable resizeable multiple mini charts color styling and font sizing, foreground/background colors candle coloring candle styles; candles, bars, line, high-low channel optional background color gradient predfined period separators on all tf's (eg 1hr/1day sep on 1Min, 4hr/1day
Market Ticker Pro MT5
John Louis Fernando Diamante
The only Market Ticker on the market! Add a professional novelty to your workspace, with built in mini-charts A scrolling Market Ticker that displays price changes from all symbols in the Market Watch list. Provides an easy snapshot of symbol prices, and keeps scrolling automatically while you trade and analyse the chart. The ticker color (+/- price changes) are based on either the current or completed candle, and the previous candle. Options include: - MTF, eg choose to show price changes o
Bollinger Bands Max MT5
John Louis Fernando Diamante
A fully featured BB indicator You're no longer limited to the built in default of using BB off a SMA method, now you can choose from: SMA - SMMA - EMA - LWMA - ADAPTIVE - FRACTAL ADAPTIVE - DEMA - TEMA - VARIABLE INDEX DYNAMIC You now also have up to 5 standard deviation levels, with price labels. Styling wise, there are color gradients provided for deviation filling, candles (bars too), deviation lines and texts. Options: - MTF - 9 choices of MA to base the BB off -  5 adjustable deviation
Pivot Types with Levels MTF MT5
John Louis Fernando Diamante
Fully featured Pivots and Levels indicator Pivots: Floor (normal), Woody, Camarilla, Fibonacci Levels: ATR, Historical Volatility with standard deviations, Close Price Volatility with standard deviations Features: - 4 +/- levels - MTF, pivots/levels based on Daily, Weekly, 4hr or even 15min - Hour and minute time offset - Texts with prices and pip distances to central pivot/level - Inputs for Camarilla/Fibonacci/ATR/Volatility levels - Alerts, popup, push, email, sound, live or completed ca
Drawing Pack MT5
John Louis Fernando Diamante
This indicator provides several drawing tools to assist in various methods of chart analysis. The drawings will keep their proportions (according to their handle trendline) across different chart scales, update in real time, and multiple drawings are supported. # Drawing Option Description  1 Grid box draggable boxed grid, user defines rows x colums, diagonal ray option  2 Grid partial or fullscreen grid, sized by handle line  3 Grid flex a diagonal grid, sized and sloped by handle line
Filtro:
C V
23
C V 2023.03.15 21:35 
 

This is a great tool. Thank you. $50 well spent.

Rispondi alla recensione