UR HighsAndLows MT5
- Indicatori
- Krzysztof Jan Debski
- Versione: 1.10
- Aggiornato: 16 maggio 2024
- Attivazioni: 5
UR Massimi e minimi
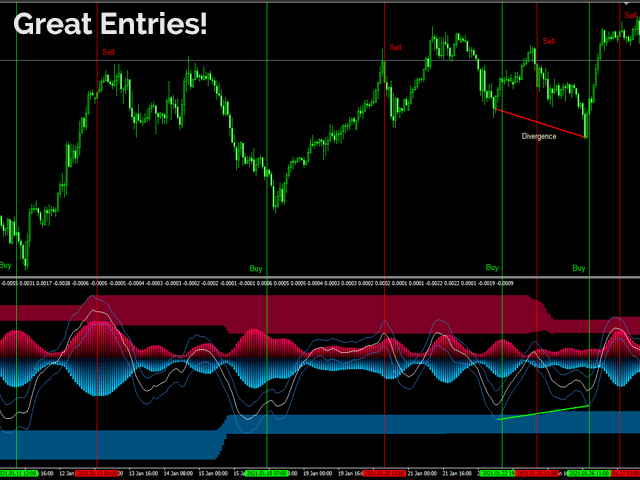
UR Highs&Lows esegue un'analisi approfondita del movimento del prezzo e della sua volatilità e crea un canale all'interno del quale il prezzo si muove. Quel canale ora si muove come un oscillatore ed è ricoperto dalla deviazione del prezzo per segnalare potenziali esaurimenti e possibili inversioni.
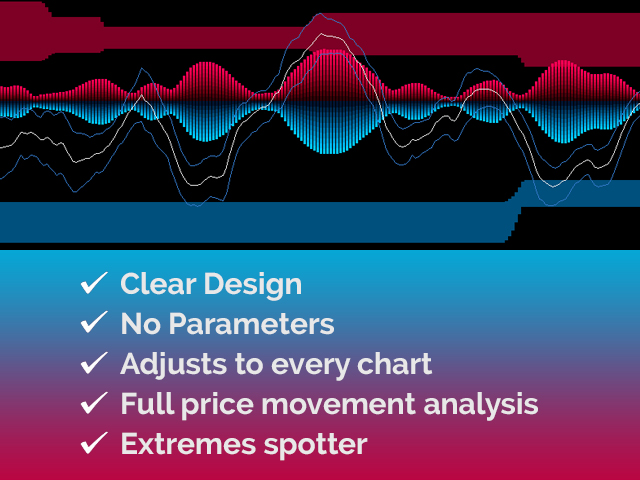
Vantaggi dell'utilizzo di UR Highs&Lows:
Nessun parametro
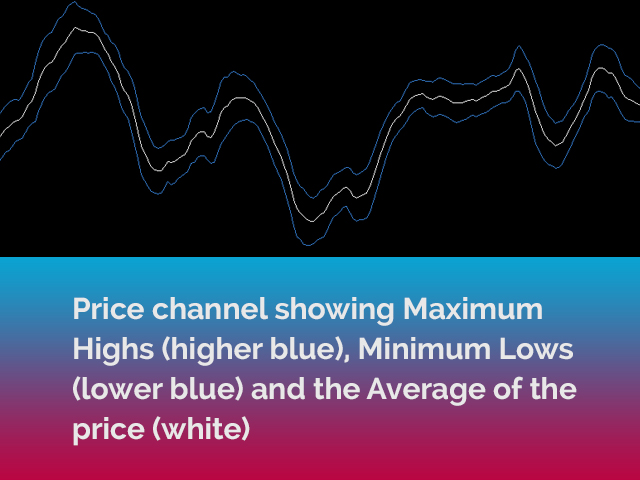
Hai 3 linee che descrivono il movimento del prezzo: la linea bianca che è una media del prezzo e le linee blu che sono i suoi estremi
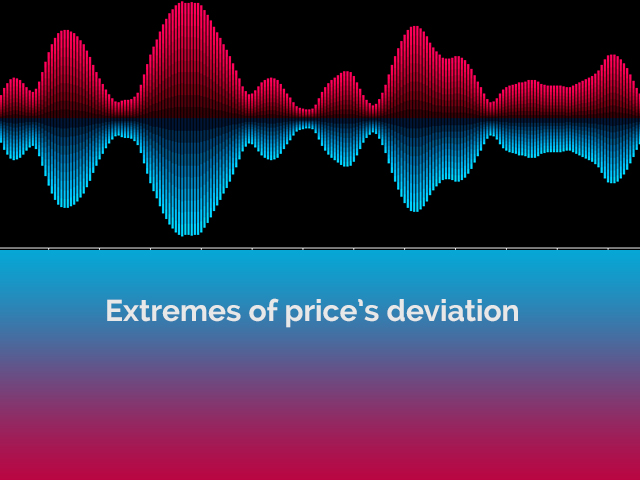
L'istogramma è una visualizzazione delle deviazioni massime nel contesto del prezzo
L'interfaccia mostra l'esaurimento di entrambe le linee su entrambi gli estremi (aree rosse superiori e blu inferiori)
Il miglior vantaggio: facile e adattato a tutte le risorse.
C'è una speciale chat di Telegram su cui puoi rimanere aggiornato sugli aggiornamenti degli strumenti e anche inviare richieste se ritieni che manchi qualcosa!
Perché UR Highs&Lows?
Questo indicatore può essere utilizzato come indicatore autonomo, di ingresso o di uscita. A causa della sua dipendenza dal prezzo, può essere applicato a qualsiasi grafico e il suo algoritmo di calcolo delle deviazioni si basa su diversi anni di esperienza e osservazione.
Come usare UR Highs&Lows?
Vedi la descrizione qui sotto per avere più familiarità con esso:
IMPOSTAZIONI
Nessuno
SCHERMO
Price Average Main Line (bianco): la media del prezzo.
Estremi di prezzo (blu): un canale calcolato degli estremi di prezzo.
Istogramma: mostra la deviazione della volatilità.
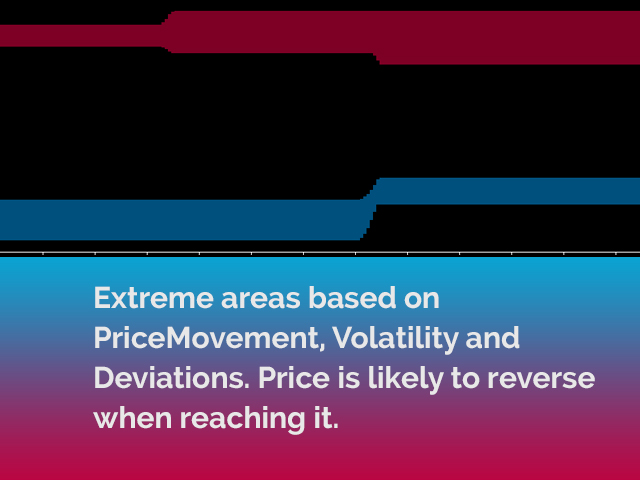
Aree estreme: aree in cui il prezzo si esaurirà e potenzialmente si invertirà.
AGGIUNTA
Tutti i miei strumenti funzionano meglio una volta assemblati. Ciò significa che la precisione dei punti di ingresso è decisamente migliore se utilizzata con UR DivergenceSpotter, UR VolumeTrend o/e UR TrendExhaustion.