Magic Lines MT4
- Indicatori
- Nikolay Georgiev
- Versione: 1.1
- Aggiornato: 20 luglio 2022
- Attivazioni: 5
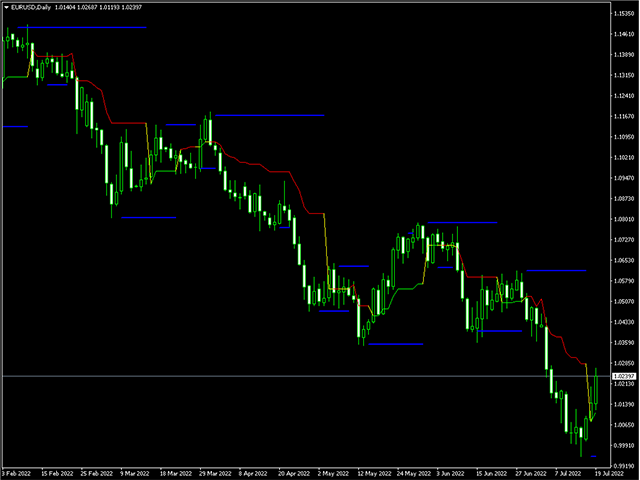
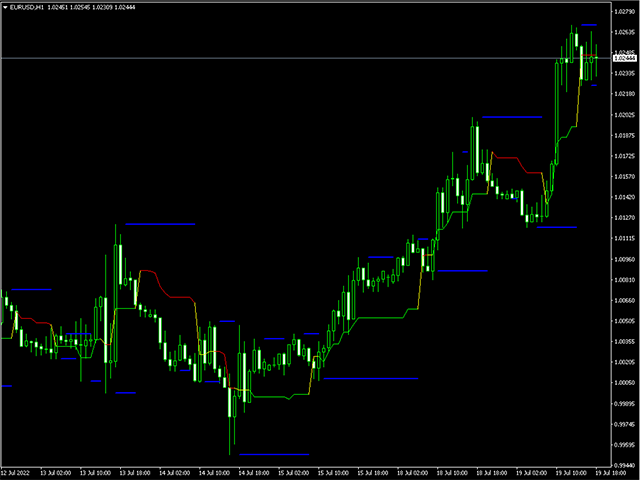
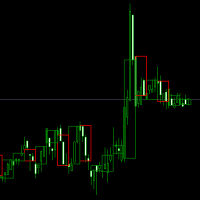
Magic Lines MT4 is an indicator which can be categorized as trend, levels and channels type. It draws a colored line which is colored in green and red depending where last close is. The value at the current open bar should not be taken into account. This part of the indicator can give us a sense whether it is trending up or down or its going sideways. Magic Lines indicator also draws blue top and bottom levels which can be taken into account for breakouts and false breakouts. A sideway zone should contain of at least two up and down bands which are nearly equal and the we can enter either on the breakout or when the zone is tested. Nevertheless its a good tool to know where the market is going.
It is also a good idea to check at lest 3 near timeframes like D1 H4 H1 to confirm the whole picture. As well you can also try M1 and M5 to get best price for entry which need experience and is not recommended for beginner traders. LOW TIMEFRAMES ARE NOT RECOMENDED IF YOU DON'T HAVE A GOOD SENSE OF RISK MANAGMENT AND SCALPING.
The code and logic behind is really simple and yet so powerful to identify the next trend movement. It draws levels that can be used for breakout entries but also that will matter further in time as supply and demand zones.
The input options give only one thing to choose - 'Calculate last X Bars' - this option doesn't affect the indicator calculation and it only limits it for how much bars back it will calculate. This is mostly used to increase performance and speed of calculations. IT IS NOT AFFECTING THE FORMULA AT ALL.
As any trend indicator this one as well is more objective on higher timeframes like Daily and H4 but it can still be used in lower ones like H1 and below.
It basically consists of a trend line which is really sensitive to change in directions and way more accurate than any combination of moving averages.
The indicator formula does not use any external built in indicator but it get information from the price action only, which makes it truly different.
The green-yellow-red line shows the trend direction. When price is above it means there is more potential for upward movement and vice versa.
The blue levels gives an insight for possible consolidation areas which after broken might be a start of a new long lived trend.
Be careful and do not instantly reverse trades after a long lasting trend and wait to see the next move.
