MACD crossover Pro
- Indicatori
- Andrey Kozak
- Versione: 3.0
- Aggiornato: 21 giugno 2022
- Attivazioni: 20
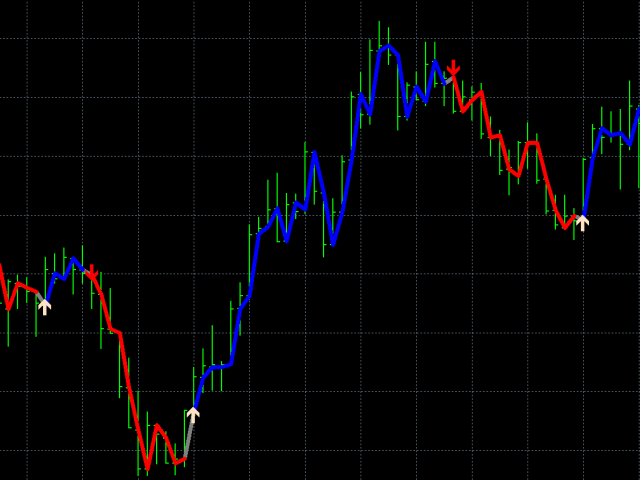
"MACD crossover" is a new version of the oscillator indicator. "MACD crossover" draws a red or blue line on the chart. When the line is blue, it means that the MACD indicator is above zero. If the line on the chart is red, it means that the MACD indicator is below zero. Thus, this indicator helps traders determine the MACD position visually on the chart. This information will be especially useful when trading scalping. You can combine this indicator and trend indicators on the chart. If this indicator draws a red line and trend indicators point to a downtrend, we open a sell order. If this indicator draws a blue line and trend indicators show a growing trend, we open a buy deal.
Benefits of the indicator:
- not redrawn
- shows the position of the MACD indicator on the chart
- helps to scalp
Indicator settings:
- arrow - turn on the display of arrows on the chart.
- signal - enable sending signals to email and phone.
- period_fast - fast average period.
- period_slow - slow moving average period.
- mode_price - used price. Maybe like this: ENUM_APPLIED_PRICE
- width - line thickness.
- LineColorBuy - line color when MACD is above zero.
- LineColorSell - line color when MACD is below zero.
- ArrowColorBuy - color of arrows when MACD crosses the chart above zero.
- ArrowColorSell - the color of the arrows when the MACD crosses the chart below zero.

