• Panoramica
  • Recensioni (5)
  • Commenti (1)
  • Novità

Multi Timeframe Support and Resistance Zones MT4

4.2

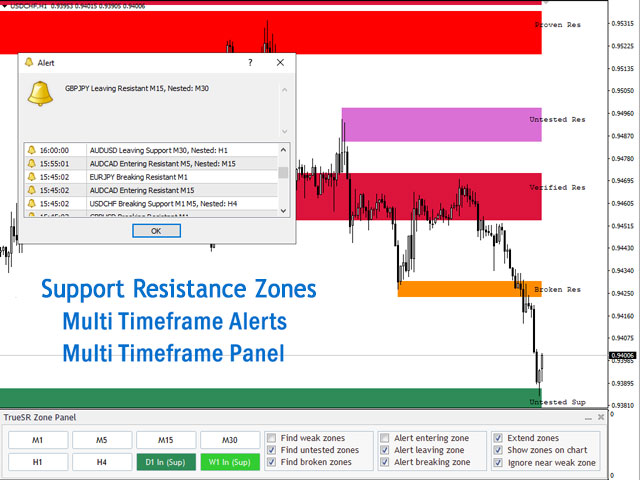
Support and Resistance zones indicator for MT4 is a multi-timeframe panel and alert that finds support and resistance zones and pivot points for all timeframes of MetaTrader 4 and gives alert when price has interaction with them.

Download demo version (works on GBPUSD, EURJPY and NZDUSD symbols)

Read the full description of scanner parameters in the blog page.

Many unique features in one indicator:

  • Integrating support and resistance zones and pivot points in one indicator with powerful filtering rules and alert system.
  • Alerts when price returns from S/R zones and pivot levels for swing trading and range trading strategies.
  • Alerts when price breaks S/R zones and pivot levels for breakout trading.
  • Finds high probability trend reversals with a full set of alert filters.
  • You can avoid getting caught in SR zones by checking them before opening a position.
  • This indicator gives you the best levels for stoploss and take profit.
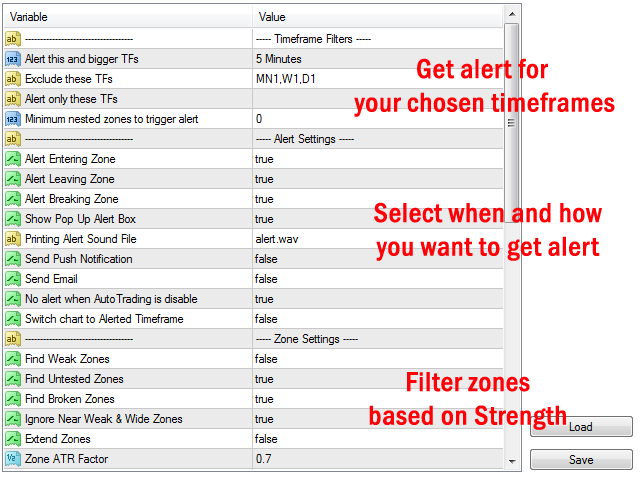
  • You will receive alerts for all timeframes without the need to switching between them.
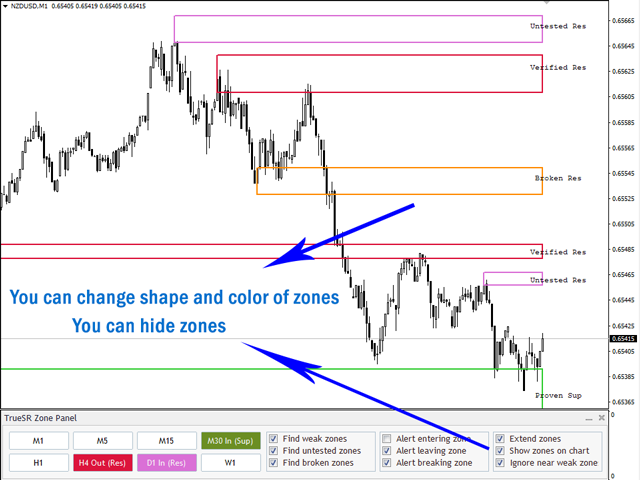
  • You can view S/R zones of multiple higher timeframes on the chart.

Powerful alert filters for S/R zones:

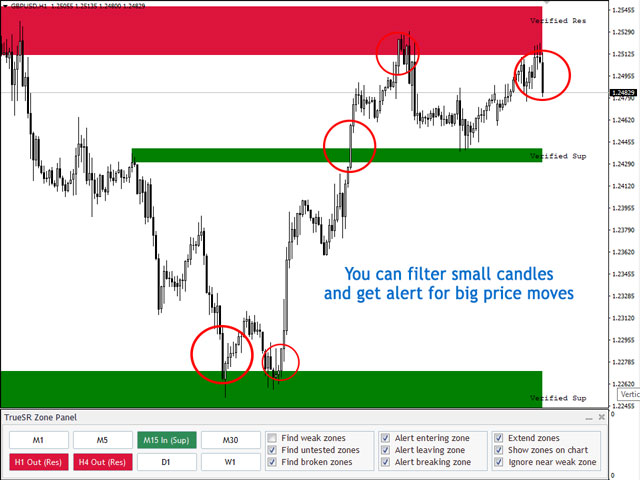
Indicator has 5 filters to ignoring low quality alerts and finding best levels for order setups: 
  • minimum candle height
  • minimum candle body to height ratio
  • minimum candle height to zone height ratio
  • comparison between candle height and the height of previous candles
  • comparison between candle body and average body length of previous candles

Informative panel:

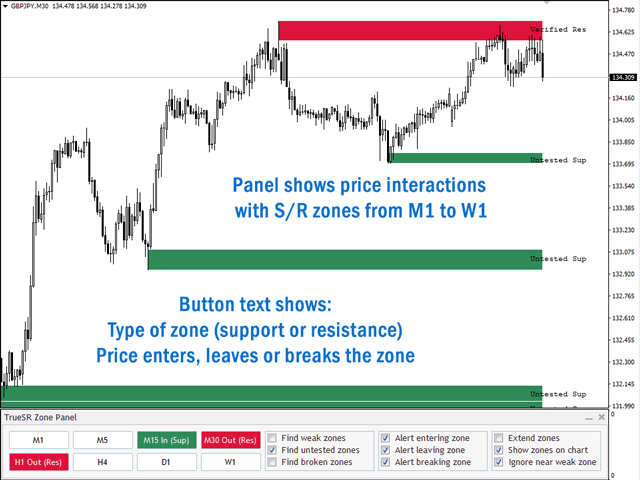
Panel shows if price has interaction with support and resistance zones from M1 to W1 timeframes. Also with panel you can find nested zones at a glance.

  •     Button text shows type of support and resistance zones (with "Sup" and "Res" abbreviations on buttons)
  •     Button text shows in which timeframes price enters, leaves or breaks a zone (with "In,Out,Br" abbreviations on buttons)
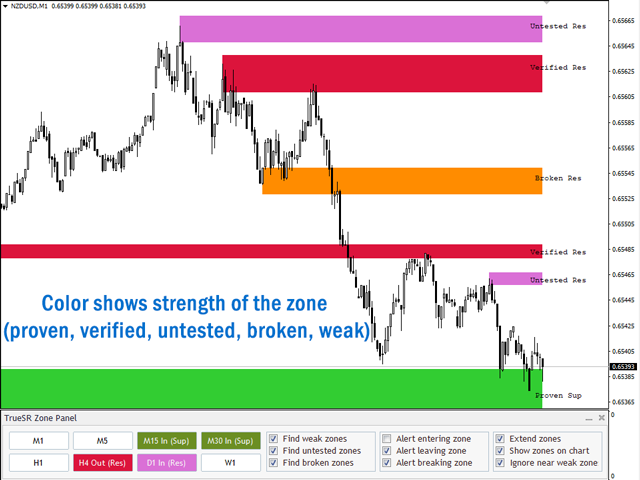
  •     Button color shows strength of support and resistance zone (you can change the color of zones)
  •     Ability to change frequently used settings directly through the panel
  •     Panel and zones will update on every 1-minute candle open and when chart time frame changes

Indicator shows the Strength of Support and Resistance Zones:

This indicator uses fractals and ATR indicator to find and draw support and resistance zones on price chart. Zones have different strength that are:

  • Weak fresh zones: high and low points in trend that price didn't touch them again yet
  • Fresh zones: important high and low points (major turning points) that price didn't touch them again yet
  • Verified zones: strong zones, price touched them before but couldn't break them
  • Proven zones: verified zone that at least four times the price can't break it
  • Broken zones: zones that price breaks them (not applied for weak zones)

Pivot Points Features:

  • Support and resistance zones indicator shows the daily, weekly and monthly pivot point levels on the chart.
  • You can receive alert when price breaks a pivot point level or returns to it.
  • You can choose between 5 different calculation type of pivot points (standard, fibonacci, camarilla, woodie and demark).

Different Alert Types:

You can enable the following alerts at the same time in the indicator settings.

  • when candle moves into a zone and closes inside it
  • when price leaves (returns from) a zone and closes outside and also price is higher or lower than previous candle
  • when price breaks a zone and closes outside of zone

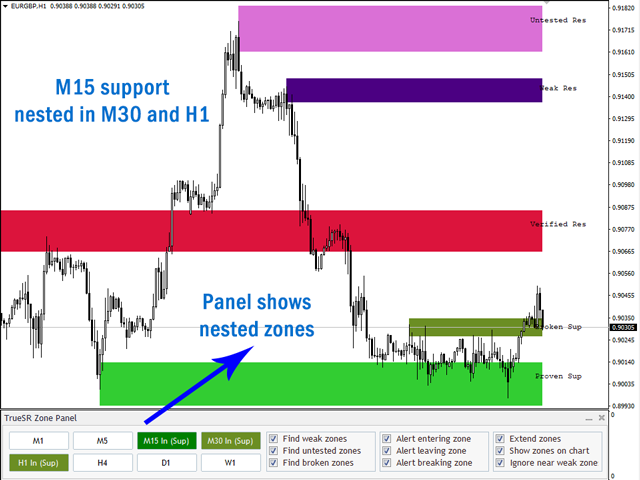
Find Nested Zones at a glance:

In panel you can see if price enters or leaves support and resistance zones in more than one timeframe at the same time. Also alert shows nested zones in other timeframes in the indicator parameters you can set the number of nested zones that must be found before alert triggers.

Use the power of Support and Resistance zones in your EAs:

This indicator has a fast and lightweight version that you can use it in the code of expert advisors and indicators for accessing the values of nearest S/R zones to price in all timeframes.

  • Bridge is included in the lifetime licenses of the indicator, contact me after buying the scanner and I'll send the bridge to you.
  • You will receive a sample EA to see how to use the bridge in expert advisor code with iCustom function .

Please check out indicator blog page for more info about the bridge.

If you have any question, please ask in the comments section. I'll do my best to answer your questions.


Recensioni 5
abobasel99
184
abobasel99 2023.07.12 09:54 
 

السلام عليكم سوف تتلقى نموذج EA لمعرفة كيفية استخدام الجسر في كود

tunck
1194
tunck 2023.07.07 03:56 
 

This should be 4 stars or up. Just hope the developer could improve R/S blocks a bit.

simonlongster
200
simonlongster 2022.08.22 11:15 
 

Just purchased and works perfectly. I'm sure this will improve my trading :) Great job Amir. Thanks :)

Prodotti consigliati
Pivot Pro
Igor Semyonov
Description Pivot Pro  is a universal color indicator of the  Pivot Points  levels systems. You can select one of its three versions:  Standard   Old , Standard New  and  Fibo . The system will automatically calculate the  Pivot Point  on the basis of market data for the previous day ( PERIOD_D1 ) and the system of support and resistance levels, three in each. It can also display price tags for each level. You can color the indicator lines. Only a method of calculation of the third level of supp
VR Cub
Vladimir Pastushak
VR Cub è un indicatore per ottenere punti di ingresso di alta qualità. L'indicatore è stato sviluppato per facilitare i calcoli matematici e semplificare la ricerca dei punti di ingresso in una posizione. La strategia di trading per la quale è stato scritto l'indicatore ha dimostrato la sua efficacia per molti anni. La semplicità della strategia di trading è il suo grande vantaggio, che consente anche ai trader alle prime armi di commerciare con successo con essa. VR Cub calcola i punti di apert
Year2Year
Stanislav Korotky
This indicator shows price changes for the same days in past years. D1 timeframe is required. This is a predictor indicator that finds D1 bars for the same days in past 8 years and shows their relative price changes on the current chart. Parameters: LookForward - number of days (bars) to show "future" price changes; default is 5; Offset - number of days (bars) to shift back in history; default is 0; ShowAverage - mode switch; true - show mean value for all 8 years and deviation bounds; false - s
FREE
Key level wedge pro
Presley Annais Tatenda Meck
5 (1)
We have combined all of our beloved indicators the likes of: Key level order block , Key level supply and demand , Key level liquidity grab and Key level wedge into one single indicator and dashboard. Whats new Dashboard : There is an easy access dashboard for all your needs. Multi-timeframe button : There is now a multi-timeframe option for Order Blocks and Supply and demand zones, making it easy to see higher timeframe zones easily on the current timeframe by just clicking the desired timefr
MetaTrend M4
Vahidreza Heidar Gholami
5 (1)
Meta Trend Indicator is an efficient way to forecast and detect the trend in any market. It reveals the trend, support and resistance levels, volatility and the maximum potential target, all in one indicator. To adapt to the price and to decrease consecutive trend failures, the internal trend detector algorithm studies the market and dynamically chooses the right values for the internal parameters. This indicator is a perfect trend filter for any strategy or expert advisor. Features Super Adapti
5TT Pivot Lines is a visual display of pivot lines. These are primarily support and resistance points with the 'Blue' Pivot Point. Pivot points are useful for determining key levels for entry or exits (setting targets and stop loss levels). Having these support & resistance lines visually displayed on the chart is very useful for intraday traders. 5TT Pivot Lines come with some user-friendly settings to decide if to display the lines or connectors on the chart Settings CandlesBack: This gives th
Daily Pivots Multi Indicator Daily Pivots Multi is an exclusive indicator to draw your pivots levels and much more. Most indicators draw daily pivots for the day. Daily Pivots Multi is able to draw levels for different days. The indicator can do the calculation for unlimited number of days backward. It means that you can draw the levels for today but also for the past days. This is very useful if you want to study a strategy with Pivots levels over a period of time. Another problem is th
Custom Pivots
Tsvetan Tsvetanov
4.2 (5)
Pivots Points are significant levels traders can use to determine directional movement, support and resistance. Pivot Points use the prior period's high, low and close to formulate future support and resistance. In this regard, Pivot Points are predictive and leading indicators. Pivot Points were originally used by floor traders to set key levels. Floor traders are the original day traders. They deal in a very fast moving environment with a short-term focus. At the beginning of the trading day,
Magic Pivot
Evgeny Belyaev
Magic Pivot is a professional indicator for finding the support and resistance lines; it has been developed by a group of professional traders. The indicator plots three support lines and three resistance lines, where a price reversal is highly probable. Magic Pivot is an excellent tool for scalping and intraday trading.   Advantages High accuracy of signals. Suitable for scalping and intraday trading. The indicator does not redraw. Simple indicator setup, minimum parameters. Works on any finan
Pivot System
Igor Semyonov
4 (1)
Description Pivot System  is a universal color multicurrency/multisymbol indicator of the  Pivot Points  levels systems. You can select one of its three versions:  Standard   Old ,  Standard New  and  Fibo . It plots pivot levels in a separate window. The system will automatically calculate the  Pivot Point  on the basis of market data for the previous day ( PERIOD_D1 ) and the system of support and resistance levels, three in each. It can also display price tags for each level. You can color t
Smart Pivot Lines
Mohamed yehia Osman
::: FREE FOR A LIMITED TIME !!!! the Smart Pivot Lines detection indicator It detects market direction By identifying super candles and major support resistance levels It detects the major breakout Candles amplified by the volume and Candle body size   and shows it in a separate window to give a great indication of market power and direction Support resistance lines are detected by a unique strategy using tick volumes , bars patterns and bars size  - if Bears dominates :: Price will be below
Indicator Support and Resistence plain in your chart seven lines; Red line=Resistence 3. Red line=Resistence 2. Red line=Resistence 1. Yellow line= Pivot. Green line= Support 1. Green line= Support 2. Green line= Support 3. adattable in all timeframe (minute 1, minute   5, minute   15, minute   30, Hour 1, Hour 4,Day 1,Week 1,Mounth 1); Buy under support and sell over the resistence;
Oversold and Overbought Candles, Trendlines, and BUY-SELL arrows in the single Indicator. Built from 8 default MT4 Indicators. Stochastic,RSI,SAR,CCI,RVI,DeMarker,WPR and MA. It is " NON REPAINT " indicator. All buffers do not repaint.  Double Trendline buffers that can also be used to identify sideway market and support resistance area.  Any timeframes and any currency pairs. Parameters: Show Trend . TRUE/FALSE to show trendlines on the chart Follow Trend. If TRUE , Dapitrend will show on
The PUA MultiType Pivot indicator is built on the daily chart of the previous day. The PUA MultiType Pivot indicator is one of the most popular tools in technical analysis, used by traders to identify potential reversal points in financial markets. This indicator constructs three types of Pivot points: Classic, Fibonacci, and Camarilla, each offering its unique approach to market analysis. The advantages of this indicator include: Simplicity and Clarity PUA MultiType Pivot provides clearly defi
Infinity Trend Pro
Yaroslav Varankin
1 (1)
This is a trend indicator without redrawing Developed instead of the binary options strategy (by the color of the Martingale candlestick) Also works well in forex trading When to open trades (binary options) A signal will appear in the place with a candle signaling the current candle It is recommended to open a deal for one candle of the current timeframe M1 and M5 When a blue dot appears, open a deal up When a red dot appears, open a trade down. How to open trades on Forex. When a signal is rec
Classic Fractals indicator for MT4, with additional Trendlines connecting the latest couples of fractals ( fractals are showing highest high, and lowest low on each period) Rules for trendlines: -if new top fractal is below the last one = new resistance line -if new bot fractal is above the last one = new support line -Trendlines can be hidden -Fractals can be hidden Fractal Period = can be both even or uneven number, as it is setting for half (one side) of the bars sequence
Bar Strength Divergence indicator for MT4
Renaud Herve Francois Candel
5 (2)
Bar Strength Divergence Indicator for MT4 BarStrength Indicator is an exclusive indicator to trade Forex, Stocks, Indices, Futures, Commodities and Cryptos. BarStrength Indicator shows the strength of each candle. The indicator shows in a separate windows candles relatively to 2 price levels representing resistance and support in the market. Once candle is near resistance it is highly probable that price movement will change direction and will go down in the next candles. Once candle is
Atomic Analyst
Issam Kassas
5 (3)
Innanzitutto, vale la pena sottolineare che questo indicatore di trading non è repaint, non è ridisegno e non presenta ritardi, il che lo rende ideale sia per il trading manuale che per quello automatico. Manuale utente: impostazioni, input e strategia. L'Analista Atomico è un indicatore di azione del prezzo PA che utilizza la forza e il momentum del prezzo per trovare un miglior vantaggio sul mercato. Dotato di filtri avanzati che aiutano a rimuovere rumori e segnali falsi, e aumentare il pote
The indicator detects and displays 3 Drives harmonic pattern (see the screenshot). The pattern is plotted by the extreme values of the ZigZag indicator (included in the resources, no need to install). After detecting the pattern, the indicator notifies of that by a pop-up window, a mobile notification and an email. The indicator highlights the process of the pattern formation and not just the complete pattern. In the former case, it is displayed in the contour triangles. After the pattern is com
Insider Scalper Binary This tool is designed to trade binary options. for short temporary spends. to make a deal is worth the moment of receiving the signal and only 1 candle if it is m1 then only for a minute and so in accordance with the timeframe. for better results, you need to select well-volatile charts.... recommended currency pairs eur | usd, usd | jpy .... the indicator is already configured, you just have to add it to the chart and trade .... The indicator signals the next can
Pivot Points Multi
Professoft Limited
Pivot Points Indicator Features: Send alerts when a pivot line is hit Displays Daily, Weekly, Monthly Indicators at the same time on the chart Restricting the time during the day when the alerts are sent Adjust the styling settings for the Pivot lines Settings: Show Daily Pivots Show Weekly Pivots Show Monthly Pivots Weekly Pivots Hit Notification Enabled Monthly Pivots Hit Notification Enabled Hit Check Frequency Time Restriction Enabled From Hour To Hour PP Color R1 Color R2 Color R3 Color S1
FreqoMaster
Stanislav Korotky
The main idea of this indicator is rates analysis and prediction by Fourier transform. The indicator decomposes exchange rates into main harmonics and calculates their product in future. The indicator shows 2 price marks in history, depicting price range in the past, and 2 price marks in future with price movement forecast. Buy or sell decision and take profit size are displayed in a text label in the indicator window. The indicator uses another indicator as an engine for calculations - FreqoMet
Wave Wolf MT4
Andrei Salanevich
L'indicatore Forex Wave wold MT4 è progettato per cercare le onde di Woolf e visualizzarle nella finestra corrente del terminale di trading. Un ottimo indicatore per i trader che utilizzano le onde di Wolfe nel trading. La sua applicazione nelle strategie di trading aumenterà notevolmente la loro efficienza e redditività. INFORMAZIONI SULL'INDICATORE A differenza di altri indicatori onda Wold, indicatore Forex onda wold MT4 ha una serie di caratteristiche che aumentano notevolmente la sua eff
Master Scalping M1 è un indicatore innovativo che utilizza un algoritmo per determinare il trend in modo rapido e preciso. L'indicatore calcola il tempo di apertura e chiusura delle posizioni, gli algoritmi dell'indicatore consentono di trovare i momenti ideali per entrare in un trade (acquistare o vendere un asset), il che aumenta il successo delle transazioni per la maggior parte dei trader. Vantaggi dell'indicatore: Facile da usare, non sovraccarica il grafico con informazioni inutili. Può es
This support and resistance indicator gives u a)support level b)resistance level c)direction(trend) all in one.The indicator is based on the top 3 best levels there are!Red dots are sell direction and green dots are buy direction,if candles dont break these levels u get in after the 3rd dot,always use higher time frames from h1 up so its more clear where direction is going,also u can set the indicator to your time frame that u are lookin at.
This is a very complex indicator that calculates resistance and supportlevels. When the calculation is done, it merges levels that are close to eachother. It support different timeframes, simply by changing timeframe. Features: See support and resistance levels Alarm can be set off when price enters a support/resistance zone Different timeframes See screenshots for visual.
Supply Demand Zone Pro Indicator works with all products and timeframes. It is using a new calculation method, and now you can select the desired zone on any timeframe! Strongest Zones are already enabled by default This is a great advantage in trading.This indicator has a built in backtester enabled by default, just move the chart. Supply and Demand ? Supply is a price zone where sellers outnumbered buyers and drove the price lower. Demand is a price zone where buyers outnumbers sellers and
An indicator of pattern #31 ("Long Island") from Encyclopedia of Chart Patterns by Thomas N. Bulkowski. The second gap is in the opposite direction. Parameters: Alerts - show alert when an arrow appears   Push - send a push notification when an arrow appears (requires configuration in the terminal) GapSize - minimum gap size in points ArrowType - a symbol from 1 to 17 ArrowVShift - vertical shift of arrows in points   ShowLevels - show levels ColUp - color of an upward line ColDn - color of
Owl smart levels
Sergey Ermolov
4.63 (54)
Versione MT5  |  FAQ L' indicatore Owl Smart Levels   è un sistema di trading completo all'interno dell'unico indicatore che include strumenti di analisi di mercato popolari come i   frattali avanzati di Bill Williams , Valable ZigZag che costruisce   la corretta struttura a onde   del mercato, e i   livelli di Fibonacci che segnano i livelli esatti di entrata nel mercato e luoghi per prendere profitti. Descrizione dettagliata della strategia Istruzioni per lavorare con l'indicatore Consulente-
Created by imjesstwoone and mickey1984, this trade model attempts to capture the expansion from the 10:00-14:00 EST 4h candle using just 3 simple steps. All of the information presented in this description has been outlined by its creators, all I did was translate it to MQL4. All core settings of the trade model may be edited so that users can test several variations, however this description will cover its default, intended behavior using NQ 5m as an example. Step 1 is to identify our Price Ra
Gli utenti di questo prodotto hanno anche acquistato
Gann Made Easy
Oleg Rodin
4.93 (87)
Gann Made Easy è un sistema di trading Forex professionale e facile da usare che si basa sui migliori principi del trading utilizzando la teoria di mr. WD Gann. L'indicatore fornisce segnali ACQUISTA e VENDI accurati, inclusi i livelli di Stop Loss e Take Profit. Puoi fare trading anche in movimento utilizzando le notifiche PUSH. Vi prego di contattarmi dopo l'acquisto! Condividerò i miei consigli di trading con te e fantastici indicatori bonus gratuitamente! Probabilmente hai già sentito parlar
Scalper Inside PRO
Alexey Minkov
4.75 (59)
An exclusive indicator that utilizes an innovative algorithm to swiftly and accurately determine the market trend. The indicator automatically calculates opening, closing, and profit levels, providing detailed trading statistics. With these features, you can choose the most appropriate trading instrument for the current market conditions. Additionally, you can easily integrate your own arrow indicators into Scalper Inside Pro to quickly evaluate their statistics and profitability. Scalper Inside
Attualmente 20% di sconto! La soluzione migliore per ogni principiante o trader esperto! Questo software per cruscotti funziona su 28 coppie di valute. Si basa su 2 dei nostri indicatori principali (Advanced Currency Strength 28 e Advanced Currency Impulse). Offre un'ottima panoramica dell'intero mercato Forex. Mostra i valori di forza delle valute avanzate, la velocità di movimento delle valute e i segnali per 28 coppie Forex in tutti i (9) timeframe. Immaginate come migliorerà il vostro t
TPSpro RFI Levels
Roman Podpora
4.86 (21)
Reversal First Impulse levels (RFI)    INSTRUCTIONS        RUS       -       ENG              R ecommended to use with an indicator   -   TPSpro  TREND PRO -  Version MT5 A key element in trading is zones or levels from which decisions to buy or sell a trading instrument are made. Despite attempts by major players to conceal their presence in the market, they inevitably leave traces. Our task was to learn how to identify these traces and interpret them correctly. Main functions: Displaying activ
AT Forex Indicator MT4
Marzena Maria Szmit
5 (2)
The AT Forex Indicator MT4 is a sophisticated trading tool designed to provide traders with a comprehensive analysis of multiple currency pairs. This   powerful indicator   simplifies the complex nature of the forex market, making it accessible for both novice and experienced traders. AT Forex Indicator uses   advanced algorithms   to detect trends, patterns and is an essential tool for traders aiming to enhance their forex trading performance. With its robust features, ease of use, and reliabl
FX Power MT4 NG
Daniel Stein
5 (11)
Ricevi il tuo aggiornamento quotidiano sul mercato con dettagli e schermate tramite il nostro Morning Briefing qui su mql5 e su Telegram ! FX Power MT4 NG è la nuova generazione del nostro popolare misuratore di forza delle valute, FX Power. Cosa offre questo misuratore di forza di nuova generazione? Tutto ciò che avete amato dell'FX Power originale IN PIÙ Analisi della forza di ORO/XAU Risultati di calcolo ancora più precisi Periodi di analisi configurabili individualmente Limite di calcolo pe
TPSproTREND PrO
Roman Podpora
4.78 (18)
TPSpro TRENDPRO  - is a trend indicator that automatically analyzes the market and provides information about the trend and each of its changes, as well as giving signals for entering trades without redrawing! The indicator uses each candle, analyzing them separately. referring to different impulses - up or down impulse. Exact entry points into transactions for currencies, crypto, metals, stocks, indices!  -  Version MT5               DETAILED DESCRIPTION                R ecommended to use with
Indicator : RealValueIndicator Description : RealValueIndicator is a powerful tool designed specifically for trading on the EURUSD pair. This indicator analyzes all EUR and USD pairs, calculates their real currency strength values, and displays them as a single realistic value to give you a head start on price. This indicator will tell you moves before they happen if you use it right. RealValueIndicator allows you to get a quick and accurate overview of the EURUSD currency pair tops and bottoms,
Presentazione       Quantum Trend Sniper Indicator   , l'innovativo indicatore MQL5 che sta trasformando il modo in cui identifichi e scambi le inversioni di tendenza! Sviluppato da un team di trader esperti con un'esperienza di trading di oltre 13 anni,       Indicatore Quantum Trend Sniper       è progettato per spingere il tuo viaggio di trading verso nuove vette con il suo modo innovativo di identificare le inversioni di tendenza con una precisione estremamente elevata. *** Acquista Quant
TrendMaestro
Stefano Frisetti
5 (3)
nota: questo indicatore e' per METATRADER4, se vuoi la versione per  METATRADER5 questo e' il link:  https://www.mql5.com/it/market/product/108123 TRENDMAESTRO ver 2.4 TRENDMAESTRO riconosce un nuovo TREND sul nascere, non sbaglia mai. La sicurezza di identificare un nuovo TREND non ha prezzo. DESCRIZIONE TRENDMAESTRO identifica un nuovo TREND sul nascere, questo indicatore prende in esame la volatilita' i volumi ed il momentum per identificare il momento in cui c'e' un'esplosione di uno 
ATTUALMENTE SCONTATO DEL 26% La soluzione migliore per ogni principiante o trader esperto! Questo indicatore è uno strumento di trading unico, di alta qualità e conveniente perché abbiamo incorporato una serie di caratteristiche proprietarie e una nuova formula. Con un solo grafico è possibile leggere la forza delle valute per 28 coppie Forex! Immaginate come migliorerà il vostro trading perché sarete in grado di individuare l'esatto punto di innesco di una nuova tendenza o di un'opportunit
M1 Arrow
Oleg Rodin
5 (14)
Una strategia intraday basata su due principi fondamentali del mercato. L'algoritmo si basa sull'analisi dei volumi e delle onde di prezzo utilizzando filtri aggiuntivi. L'algoritmo intelligente dell'indicatore fornisce un segnale solo quando due fattori di mercato si combinano in uno solo. L'indicatore calcola le onde di un certo intervallo sul grafico M1 utilizzando i dati dell'intervallo di tempo più alto. E per confermare l'onda, l'indicatore utilizza l'analisi per volume. Questo indicatore
Advanced Supply Demand
Bernhard Schweigert
4.92 (313)
CURRENTLY 26% OFF !! Best Solution for any Newbie or Expert Trader! This indicator is a unique, high quality and affordable trading tool because we have incorporated a number of proprietary features and a new formula. With this update, you will be able to show double timeframe zones. You will not only be able to show a higher TF but to show both, the chart TF, PLUS the higher TF: SHOWING NESTED ZONES. All Supply Demand traders will love it. :) Important Information Revealed Maximize the potenti
Quantum Breakout Indicator PRO
Bogdan Ion Puscasu
4.96 (26)
Presentazione       Quantum Breakout PRO   , l'innovativo indicatore MQL5 che sta trasformando il modo in cui scambi le zone di breakout! Sviluppato da un team di trader esperti con un'esperienza di trading di oltre 13 anni,   Quantum Breakout PRO   è progettato per spingere il tuo viaggio di trading a nuovi livelli con la sua strategia innovativa e dinamica della zona di breakout. Quantum Breakout Indicator ti fornirà frecce di segnalazione sulle zone di breakout con 5 zone target di prof
NAM Order Blocks
NAM TECH GROUP, CORP.
5 (1)
MT4 Multi-timeframe Order Blocks detection indicator. Features - Fully customizable on chart control panel, provides complete interaction. - Hide and show control panel wherever you want. - Detect OBs on multiple timeframes. - Select OBs quantity to display. - Different OBs user interface. - Different filters on OBs. - OB proximity alert. - ADR High and Low lines. - Notification service (Screen alerts | Push notifications). Summary Order block is a market behavior that indicates order collection
FX Volume
Daniel Stein
4.61 (36)
Ricevi il tuo aggiornamento quotidiano sul mercato con dettagli e schermate tramite il nostro Morning Briefing qui su mql5 e su Telegram ! FX Volume è il PRIMO e UNICO indicatore di volume che fornisce una visione REALE del sentiment del mercato dal punto di vista del broker. Fornisce informazioni straordinarie su come gli operatori di mercato istituzionali, come i broker, sono posizionati sul mercato Forex, molto più velocemente dei rapporti COT. Vedere queste informazioni direttamente sul vo
Enigmera
Ivan Stefanov
5 (4)
ENIGMERA: Il cuore del mercato https://www.enigmera.com Introduzione Questo indicatore e sistema di trading rappresenta un approccio straordinario ai mercati finanziari. ENIGMERA utilizza i cicli frattali per calcolare con precisione i livelli di supporto e resistenza. Mostra l'autentica fase di accumulazione e fornisce direzione e obiettivi.  Un sistema che funziona sia in un trend che in una correzione.  Come funziona? ENIGMERA è composto da tre linee: la linea di supporto/resistenza, la
TrendDecoder Premium
Christophe Pa Trouillas
5 (6)
Identificare i range e le prossime mosse probabili   |  Ottenere i primi segnali e la forza delle tendenze   |  Ottenere uscite chiare prima dell'inversione   |  Individuare i livelli di Fibo che il prezzo testerà Indicatore non tracciante e non ritardato - ideale per il trading manuale e automatizzato - adatto a tutti gli asset e a tutte le unità temporali Offerta limitata nel tempo >>   50% OFF Dopo l'acquisto, contattatemi su questo canale  per le impostazioni personalizzate. Versione   MT5 :
Cycle Sniper
Elmira Memish
4.41 (37)
NEW YEAR SALE PRICE FOR LIMITED TIME!!! Please contact us after your purchase and we will send you the complimentary indicators to complete the system Cycle Sniper is not a holy grail but when you use it in a system which is explained in the videos, you will feel the difference. If you are not willing to focus on the charts designed with Cycle Sniper and other free tools we provide, we recommend not buying this indicator. We recommend watching the videos about the indiactor and system before pu
Legacy of Gann
Pavel Zamoshnikov
4.85 (13)
The indicator very accurately determines the levels of the possible end of the trend and profit fixing. The method of determining levels is based on the ideas of W.D.Gann, using an algorithm developed by his follower Kirill Borovsky. Extremely high reliability of reaching levels (according to K. Borovsky  - 80-90%) Indispensable for any trading strategy – every trader needs to determine the exit point from the market! Precisely determines targets on any timeframes and any instruments (forex, met
All in One Trade
Alexey Minkov
4.48 (27)
The All-in-One Trade Indicator (AOTI) determines daily targets for EURUSD, EURJPY, GBPUSD, USDCHF, EURGBP, EURCAD, EURAUD, AUDJPY, GBPAUD, GBPCAD, GBPCHF, GBPJPY, AUDUSD, and USDJPY. All other modules work with any trading instruments. The indicator includes various features, such as Double Channel trend direction, Price channel, MA Bands, Fibo levels, Climax Bar detection, and others. The AOTI indicator is based on several trading strategies, and created to simplify market analysis. All-in-One
Currency Strength Wizard è un indicatore molto potente che ti fornisce una soluzione all-in-one per un trading di successo. L'indicatore calcola la potenza di questa o quella coppia forex utilizzando i dati di tutte le valute su più intervalli di tempo. Questi dati sono rappresentati in una forma di indice di valuta facile da usare e linee elettriche di valuta che puoi utilizzare per vedere il potere di questa o quella valuta. Tutto ciò di cui hai bisogno è collegare l'indicatore al grafico che
TakePropips Donchian Trend Pro
Eric John Pajarillaga Aldana
4.61 (18)
TakePropips Donchian Trend Pro   (MT4) è uno strumento potente ed efficace che rileva automaticamente la direzione del trend utilizzando il canale Donchian e ti fornisce segnali di trading di entrata e uscita! Questo indicatore multifunzione include uno scanner di tendenza, segnali di trading, pannello statistico, screener, sessioni di trading e dashboard della cronologia degli avvisi. È progettato per fornirti segnali di trading e farti risparmiare ore analizzando i grafici! È possibile scarica
ICT, SMC, SMART MONEY CONCEPTS, SMART MONEY, Smart Money Concept, Support and Resistance, Trend Analysis, Price Action, Market Structure, Order Blocks, BOS/CHoCH,   Breaker Blocks ,  Momentum Shift,   Supply&Demand Zone/Order Blocks , Strong Imbalance, HH/LL/HL/LH,    Fair Value Gap, FVG,  Premium  &   Discount   Zones, Fibonacci Retracement, OTE, Buy Side Liquidity, Sell Side Liquidity, BSL/SSL Taken, Equal Highs & Lows, MTF Dashboard, Multiple Time Frame, BigBar, HTF OB, HTF Market Structure, 
Entry Points Pro
Yury Orlov
4.7 (226)
Indicatore top per MT5 che fornisce segnali accurati per entrare in un trade senza riverniciare! Può essere applicato a qualsiasi attività finanziaria: forex, criptovalute, metalli, azioni, indici.  La versione MT5 è qui Fornirà segnali di trading piuttosto precisi e ti dirà quando è meglio aprire un trade e chiuderlo. Guarda il video (6:22) con un esempio di elaborazione di un solo segnale che ha ripagato l'indicatore! La maggior parte dei trader migliora i propri risultati di trading
PTS Precision Index Oscillator V2
PrecisionTradingSystems
5 (2)
L'Oscillatore dell'Indice di Precisione (Pi-Osc) di Roger Medcalf di Precision Trading Systems La Versione 2 è stata attentamente rielaborata per essere estremamente veloce nel caricarsi sul tuo grafico e sono state apportate alcune altre migliorie tecniche per migliorare l'esperienza. Il Pi-Osc è stato creato per fornire segnali di sincronizzazione del trading accurati progettati per individuare punti di esaurimento estremi, i punti ai quali i mercati vengono costretti a recarsi solo per e
Welcome to the world of SMC (Smart Money Concepts) Trading, where we empower traders with the tools and knowledge to make smarter trading decisions. Our latest addition to our suite of trading tools is the SMC Trading Pro indicator, version 1.0. Key Features: Major Market Structure Identification with BODY break. Order Block must be in Major Swing ( not Small Swing ). Order Block with Fair Value Gap Detection. Order Block in Discount | Premium zone. Filter for only Bullish, Bearish or All Order
ZeusArrow Smart Liquidity Finder  Smart Liquidity Finder is Ai controlled indicator based on the Idea of Your SL is My Entry. It scan and draws the major Liquidity areas on chart partitioning them with Premium and Discount Zone and allows you find the best possible trading setups and help you decide the perfect entry price to avoid getting your Stop Loss hunted . Now no more confusion about when to enter and where to enter. Benefit from this one of it's kind trading tool powered by Ai an trade
R. Cos'è l'A2SR ?   * È un indicatore tecnico leader (nessuna riverniciatura, nessun ritardo). -- Guida : -- su https://www.mql5.com/en/blogs/post/734748/page4#comment_16532516 -- e https://www.mql5.com/en/users/yohana/blog A2SR ha una tecnica speciale per determinare i livelli di supporto (domanda) e resistenza (offerta). A differenza del modo ordinario che abbiamo visto in rete, A2SR ha un concetto originale nel determinare i livelli effettivi di SR. La tecnica originale non è stata presa
PRO Renko System
Oleg Rodin
5 (25)
PRO Renko System è un sistema di trading altamente accurato appositamente progettato per il trading di grafici RENKO. Questo è un sistema universale che può essere applicato a vari strumenti di trading. Il sistema neutralizza efficacemente il cosiddetto rumore di mercato che consente di accedere a segnali di inversione accurati. L'indicatore è molto facile da usare e ha un solo parametro responsabile della generazione del segnale. Puoi facilmente adattare lo strumento a qualsiasi strumento
Altri dall’autore
Moving Average Trend Scanner is a multi symbol multi timeframe triple MA crossover dashboard that helps traders to monitor, and identify potential market trends from one chart. This panel scans 3 moving averages in up to 28 configurable instruments and 9 timeframes for triple moving average alignment and moving average crossover  with a deep scan feature to scan all market watch symbols (up to 1000 instruments!). Download Demo here  (Scans only M1 and M5) Settings description here MT5 version
RSI divergence indicator finds divergences between price chart and   RSI   indicator and informs you with alerts (popup, mobile notification or email). Its main use is to find trend reversals in the chart. Always use the divergence indicators with other technical assets like support resistance zones, candlestick patterns and price action to have a higher possibility to find trend reversals. Three confirmation type for   RSI   divergences: RSI   line cross 50 level Price returns to previous H/L C
FREE
MACD divergence indicator finds divergences between price chart and MACD indicator and informs you with alerts (popup, mobile notification or email) . Its main use is to find trend reversals in the chart. Always use the divergence indicators with other technical assets like support resistance zones, candlestick patterns and price action to have a higher possibility to find trend reversals. Three confirmation type for MACD divergences: MACD line cross zero level Price returns to previous H/L Crea
FREE
RSI divergence indicator finds divergences between price chart and RSI   indicator and informs you with alerts (popup, mobile notification or email). Its main use is to find trend reversals in the chart. Always use the divergence indicators with other technical assets like support resistance zones, candlestick patterns and price action to have a higher possibility to find trend reversals. Three confirmation type for RSI   divergences: RSI   line cross 50 level Price returns to previous H/L Creat
FREE
Candlestick Pattern Scanner is a multi-timeframe and multi-symbol dashboard and alert system that checks all timeframes and currency pairs for different candlestick patterns that are formed in them. Scanner is integrated with support and resistance zones so you can check the candlestick patterns in the most important areas of the chart to find breakout and reversal patterns in the price chart. Download demo version   (works on M1,M5,M30,W1 timeframes) Read the full description of scanner paramet
Ichimoku Trend Alert is the Ichimoku Kinko Hyo indicator with Alerts and signal filters. Ichimoku Trend Alert features: Optional check of Ichimoku cloud, Tenkan sen(Conversion Line), Kijun sen(Base Line), Senkou span A, Senkou span B, and Chikou span relative to price, and more. Popup, email, and phone notification alerts for selected symbols and timeframes. There are 9 classic Ichimoku trend filters you can enable/disable in settings: Price/Cloud Order:   Checks the price position relative
FREE
Support and Resistance Dashboard for MT5 is a multi-timeframe and multi-symbol scanner and alert system that finds S/R zones and pivot points for all timeframes and symbols and alerts when price has interaction with them. If you are using support and resistance (or supply and demand) zones in your trading strategy, this dashboard and its alert and filtering system is a big time saver for you. Download demo version   (works on M4,M5,M6,M12,H3,H8 timeframes) Full description of scanner parameters
Moving Average Trend Alert is a triple MA indicator that helps traders to identify potential market trends based on 3 MAs alignment and crossover. Moving Average Trend Alert features: Customizable short-term, medium-term, and long-term MAs. Option to filter signals based on a minimum distance between moving averages to avoid premature MAs alignment. Optional Filter of signals with RSI indicator overbought/oversold levels. Optional Filter of signals with ADX indicator. Popup, email, and phone n
FREE
RSI Divergence Scanner is a multi-timeframe and multi-symbol dashboard and alert that checks all timeframes and symbols to find regular and hidden divergences between price chart and RSI indicator. This divergence scanner is integrated with support and resistance zones so you can check the RSI divergences in the most important areas of the chart to find trend reversals in price chart. Download demo version   (works on M4,M5,M6,M12,H3,H8 timeframes) Full description of scanner parameters ->   cli
Advanced Indicator Scanner is a multi-symbol multi-timeframe scanner that works with hundreds of custom indicators available across the web including mql5 website market and codebase indicators. Advanced Indicator Scanner features: Scans your indicator in 28 customizable instruments and 9 timeframes. Monitors up to 2 lines(buffers) of an indicator. Showing of indicator value on buttons. You can choose between 3 alert modes:  Single symbol and timeframe Multiple timeframes of a symbol Multipl
Stochastic Scanner is a multi symbol multi timeframe Stochastic dashboard that monitors the indicator for price entering and exiting overbought and oversold in up to 28 symbols and 9 timeframes. Download Demo here  (Scans only M1, M5 and M10) Settings description   here MT4 version   here Stochastic Scanner features: Signals price entering and exiting the overbought and oversold zones. Monitors up to 28 customizable instruments and 9 timeframes at the same time. Supports all 21 timeframes o
Moving Average Trend Alert is a triple MA indicator that helps traders to identify potential market trends based on 3 MAs alignment and crossover. Moving Average Trend Alert features: Customizable short-term, medium-term, and long-term MAs. Option to filter signals based on a minimum distance between moving averages to avoid premature MAs alignment. Optional Filter of signals with RSI indicator overbought/oversold levels. Optional Filter of signals with ADX indicator. Popup, email, and phone n
FREE
MACD divergence indicator finds divergences between price chart and MACD indicator and informs you with alerts (popup, mobile notification or email). Its main use is to find trend reversals in the chart. Always use the divergence indicators with other technical assets like support resistance zones, candlestick patterns and price action to have a higher possibility to find trend reversals. Three confirmation type for MACD divergences: MACD line cross zero level Price returns to previous H/L Creat
FREE
Reward Multiplier is a semi-automatic trade manager based on pyramid trading that opens additional orders with the running profit of your trades to maximize return exponentially without increasing the risk. Unlike other similar EAs, this tool shows potential profit/loss and reward to risk ratio before even entering the first trade! Download Demo here  (starting lot is fixed at 0.01) Guide + tips here MT5 version   here You only open the first order. When your trade goes into profit RM opens
Ichimoku Trend Alert is the Ichimoku Kinko Hyo indicator with Alerts and signal filters. Ichimoku Trend Alert features: Optional check of Ichimoku cloud, Tenkan sen(Conversion Line), Kijun sen(Base Line), Senkou span A, Senkou span B, and Chikou span relative to price, and more. Popup, email, and phone notification alerts for selected symbols and timeframes. There are 9 classic Ichimoku trend filters you can enable/disable in settings: Price/Cloud Order: Checks the price position relative to
FREE
MACD Divergence Scanner is a multi-timeframe and multi-symbol dashboard and alert that checks all timeframes and symbols to find regular and hidden divergences between price chart and MACD indicator. This divergence scanner is integrated   with support and resistance zones so you can check the MACD divergences in the most important areas of the chart to find trend reversals in the price chart. Download demo version   (works on M4,M5,M6,M12,H3,H8 timeframes) Full description of scanner parameters
Reward Multiplier is a semi-automatic trade manager based on pyramid trading that opens additional orders with the running profit of your trades to maximize return exponentially without increasing the risk. Unlike other similar EAs, this tool shows potential profit/loss and reward to risk ratio before even entering the first trade! Download Demo here  (starting lot is fixed at 0.01) Guide + tips here MT4 version   here You only open the first order. When your trade goes into profit RM opens a n
RSI Divergence Scanner is a multi-timeframe and multi-symbol dashboard and alert that checks all timeframes and symbols to find divergences between price chart and RSI indicator. This divergence scanner is integrated with support and resistance zones so you can check the RSI divergences in the most important areas of the chart to find trend reversals in the price chart. Download demo version   (works on M 1,M5,M30,W1 timeframes) Full description of scanner parameters ->   click here . How to get
Candlestick Pattern Scanner is a multi-timeframe and multi-symbol dashboard and alert system that checks all timeframes and currency pairs for different candlestick patterns that are formed in them. Scanner is integrated   with support and resistance zones so you can check the candlestick patterns in most important areas of the chart to find breakout and reversal patterns in the price chart. Download demo version   (works on M4,M5,M6,M12,H3,H8 timeframes) Read the full description of scanner par
Reward Multiplier is a semi-automatic trade manager based on pyramid trading that opens additional orders with the running profit of your trades to maximize return exponentially without increasing the risk.Unlike other similar EAs, this tool shows potential profit/loss and reward to risk ratio before even entering the first trade! Download full version here  ( In the mini version. Starting lot is fixed at 0.01 (or minimum allowed lot size ) Guide + tips here MT4 version   here You only open the
FREE
Order Manager is a trade assistant with money manager that helps traders open, modify and close manual trades in a simple way to help them focus more on their market analysis and open orders with just a few clicks. Download Demo here  (It only works on demo accounts) Full guide   here MT4 version here Order Manager features: Works on all instruments such as currency pairs, CFD, metals, cryptocurrencies, etc. Proper money management with a built-in lot calculator that includes five lot calcu
Support and Resistance Dashboard for MT4 is a multi-timeframe and multi-symbol scanner and alert system that finds S/R zones and pivot points for all timeframes and symbols and alerts when price has interaction with them. If you are using support and resistance (or supply and demand) zones in your trading strategy, this dashboard and its alert and filtering system is a big time saver for you. Download demo version   (works on M 1,M5,M30,W1   timeframes) Full description of scanner parameters ->
Ichimoku Assistant is a multi-timeframe panel and alert system that scans all timeframes for multiple rules related to different ichimoku strategies. The Ichimoku indicator has 5 different lines, including Tenkan-sen, Kijun-sen, Senku Span A, Senku Span B and Chikou Span. This scanner checks the status of these lines compared to each other and gives alert based on your selected rules. If you are using ichimoku kinko hyo in your trading strategy, this scanner and its alert and filtering system is
50% off. Original price: $60 Triangle Finder is a multi symbol multi timeframe dashboard that monitors and finds symmetrical triangle pattern in 28 symbols and 9 timeframes with a deep scan feature to scan all market watch symbols (up to 1000 instruments!). Download Demo here  (Scans only M1 and M5) Settings description   here MT5 version   here Triangle Finder features: Realtime monitoring of 28 customizable instruments and 9 timeframes at the same time. Deep scan mode to scan all market w
Advanced Bollinger Bands Scanner is a multi symbol multi timeframe Bollinger bands dashboard that monitors and analyzes the Bollinger Bands indicator from one chart. This panel monitors the Bollinger bands indicator in up to 28 configurable instruments and 9 timeframes for price overbought/oversold, price consolidation (Bollinger bands squeeze), and consolidation breakout (squeeze break)  with a deep scan feature to scan all market watch symbols (up to 1000 instruments!). Download Demo here  
50% off. Original price: $60 Triangle Finder is a multi symbol multi timeframe dashboard that finds symmetrical triangle pattern in 28 symbols and 9 timeframes with a deep scan feature to scan all market watch symbols (up to 1000 instruments!). Download Demo here  (Scans only M1, M5 and M10) Settings description   here MT4 version   here Triangle Finder features: Realtime monitoring of 28 customizable instruments and 9 timeframes at the same time. Deep scan mode to scan all market watch sym
Order Manager is a trade assistant with money manager that helps traders open, modify and close manual trades in a simple way to help them focus more on their market analysis and open orders with just a few clicks. Download Demo here  (It only works on demo accounts) Full guide   here MT5 version here Order Manager features: Works on all instruments such as currency pairs, CFD, metals, cryptocurrencies, etc. Proper money management with a built-in lot calculator that includes five lot calcu
ATR Scanner Pro is a multi symbol multi timeframe volatility scanner that monitors and analyzes Average True Range indicator value in up to 28 symbols and 9 timeframes in 3 modes : ATR value:  As a volatility dashboard it shows the ATR indicator value in all pairs and timeframes and signals when the ATR value reaches a maximum or minimum in a given duration. Short term ATR/Long term ATR ratio:  It shows ratio of 2 ATRs with different periods. It's useful in detecting short term volatility and e
Ichimoku Trend Finder is a multi symbol multi timeframe trend dashboard that helps traders to monitor and identify potential market trends from one chart. This panel scans the Ichimoku Kinko Hyo indicator in 28 configurable instruments and 9 timeframes for classic Ichimoku trend signals  with a deep scan feature to scan all market watch symbols (up to 1000 instruments!).    Download Demo here  (Scans only M1 and M5) Settings description   here MT5 version   here After the purchase, don't fo
MACD Divergence Scanner is a multi-timeframe and multi-symbol dashboard and alert that checks all timeframes and symbols to find regular and hidden divergences between price chart and MACD indicator. This divergence scanner is integrated with support and resistance zones so you can check the MACD divergences in the most important areas of the chart to find trend reversals in the price chart. Download demo version   (works on M 1,M5,M30,W1   timeframes) Full description of scanner parameters ->  
Filtro:
abobasel99
184
abobasel99 2023.07.12 09:54 
 

السلام عليكم سوف تتلقى نموذج EA لمعرفة كيفية استخدام الجسر في كود

Amir Atif
63751
Risposta dello sviluppatore Amir Atif 2023.07.12 13:16
Hi Abobasel
I sent the bridge file and the sample EA to you.
Please let me know if you have any questions.
Regards
tunck
1194
tunck 2023.07.07 03:56 
 

This should be 4 stars or up. Just hope the developer could improve R/S blocks a bit.

Terry Alan Lamb
483
Terry Alan Lamb 2022.12.08 01:23 
 

From what I have seen the entire indicator repaints and that’s a problem.

Amir Atif
63751
Risposta dello sviluppatore Amir Atif 2022.12.08 11:12
Hi Terry, thanks for your feedback.
Indicator doesn't repaint, it removes the support and resistance zones when they are not valid anymore and finds newly formed zones.
Regards
simonlongster
200
simonlongster 2022.08.22 11:15 
 

Just purchased and works perfectly. I'm sure this will improve my trading :) Great job Amir. Thanks :)

Amir Atif
63751
Risposta dello sviluppatore Amir Atif 2022.08.24 18:29
Hi Simon, thank you, please pm me if you have any suggestions to improve the indicator.
bighead1971
2360
bighead1971 2022.08.16 05:42 
 

Good. it would have been 5 stars if the charts can be opened with my own saved template.

Amir Atif
63751
Risposta dello sviluppatore Amir Atif 2022.08.19 12:03
Hi
Thanks for your suggestion, in the new version I added 2 parameters to the indicator so you can select to open a new chart by clicking on a timeframe button, and you can write the name of your saved chart template.
Regards
Rispondi alla recensione
Versione 4.1 2022.12.04
+ Now indicator can show zones of multiple higher timeframes on the chart.
! Minor bug fixes and improvements.
Versione 4.0 2022.11.09
+ Pivot point lines and alerts (daily, weekly, and monthly) added to the indicator.
+ Input parameters modified and updated.
Versione 3.1 2022.10.20
+ You can now choose when the indicator check for alerts: on timeframe candle close or on 1-minute candle close.
+ More informative alert messages.
Versione 3.0 2022.10.16
+ 2 more candle filters added to the indicator: "Min. candle body to height ratio" and "Min. candle height to zone height ratio".
+ The panel buttons now show whether the price is in the S/R zones (previously the buttons only showed the price moving in, out or breaking the zones).
+ Now you can choose to disable finding the proven and verified zones (for those who want to work only with fresh zones).
+ "Weak" and "Untested" names for zones changed to more meaningful names "Weak fresh" and "Fresh".
+ 2 parameters "Fractal Fast Factor" and "Fractal Fast Factor" added for more compatibility with "Shved Supply and Demand" indicator.
! Now panel retains its min/max state when timeframe changes.
Versione 2.4 2022.09.11
+ A new option added to only show nearest zones to the price on the chart, this way you can have a cleaner chart to add your indicators and objects.
Versione 2.3 2022.08.19
Now you can select that by clicking on the timeframe buttons, instead of changing the chart timeframe, a new chart opens with your selected chart template.