VWAP Indicator by PipTick MT5
- Indicatori
- Michal Jurnik
- Versione: 1.5
- Aggiornato: 1 dicembre 2021
- Attivazioni: 5
The VWAP indicator is our version of the popular Volume-Weighted Average Price indicator. The VWAP is the ratio between the value traded (price multiplied by the number of volume traded) and the total volume traded over a specific time period. As a result, it measures the average price of the instrument much better than the simple moving average. Although there are many ways to use the VWAP, most investors use it to calculate the daily average.
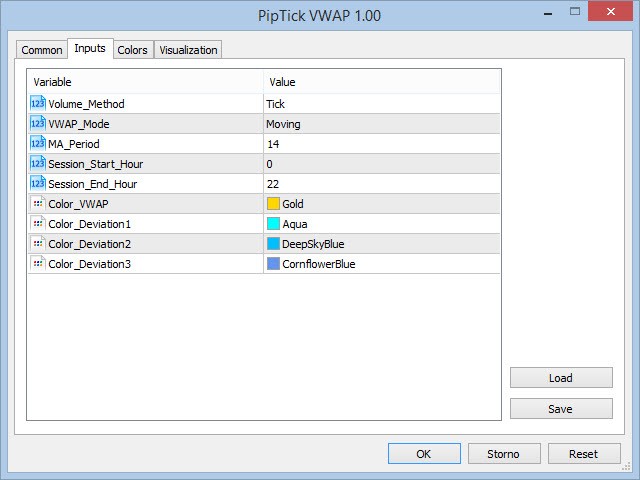
The indicator works in five modes:
- Moving - In this mode, the WVAP works as Moving Average with the specified period.
- Daily - In this mode, the VWAP is calculated from the start to the end of the day.
- Weekly - In this mode, the VWAP is calculated from the beginning to the end of the week.
- Monthly - In this mode, the VWAP is calculated from the start to the end of the month.
- Session Time - In this mode, the user can set the beginning and end hours for the VWAP calculation.
How to use the VWAP indicator
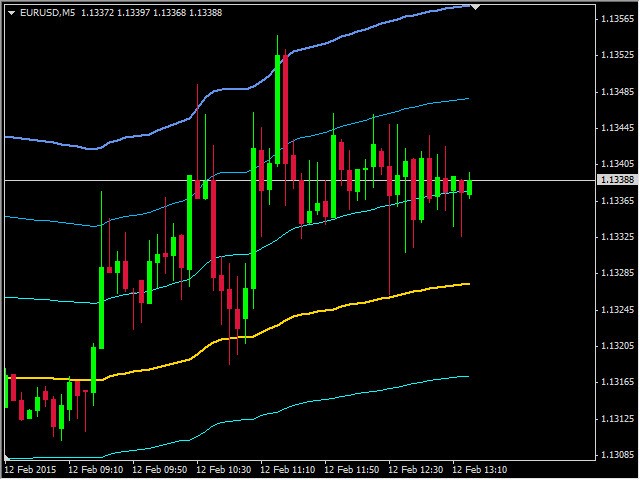
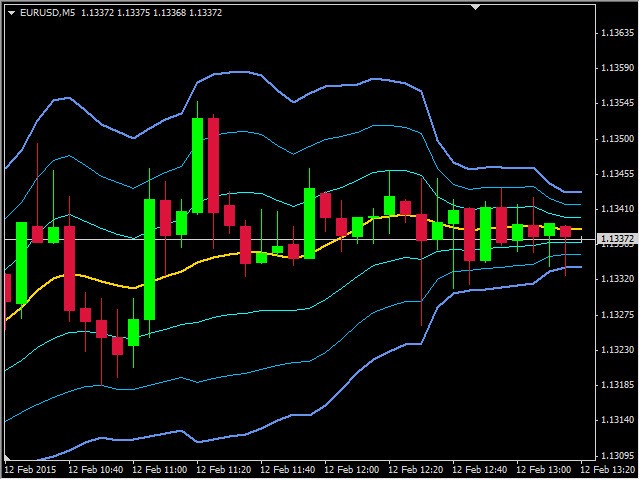
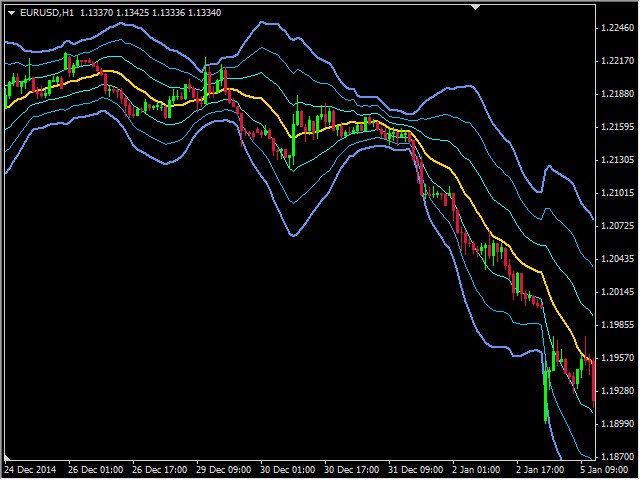
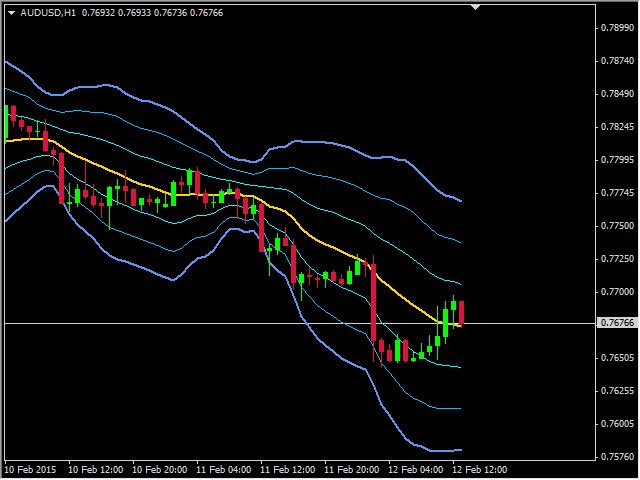
Many traders use VWAP bands in the same way as Bollinger Bands. You can look for reverse trades on the second and third standard deviations from the VWAP. Combined with price action or candle patterns, you can achieve excellent results. Of course, the VWAP indicator can also be used for benchmarking, as many investors are doing.
Main features
- Several optional modes.
- Real and tick volume calculation (MT5).
- First, second and third standard deviation from the VWAP.
- A very fast and reliable indicator.
- Customizable parameters (Colors, Line thickness, VWAP period...).
- Can be used for creating EA (Expert Advisor).
- Available for MT4 and MT5.