RSI Signals Indicator of RSI Oscillator
- Indicatori
- Raul Canessa Castameda
- Versione: 1.4
- Aggiornato: 18 ottobre 2023
- Attivazioni: 10
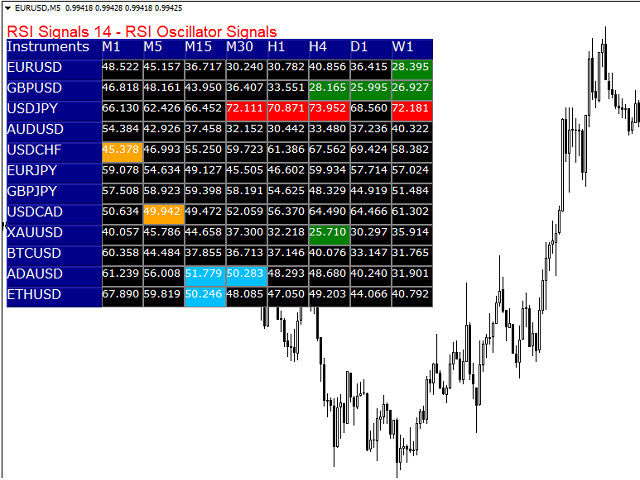
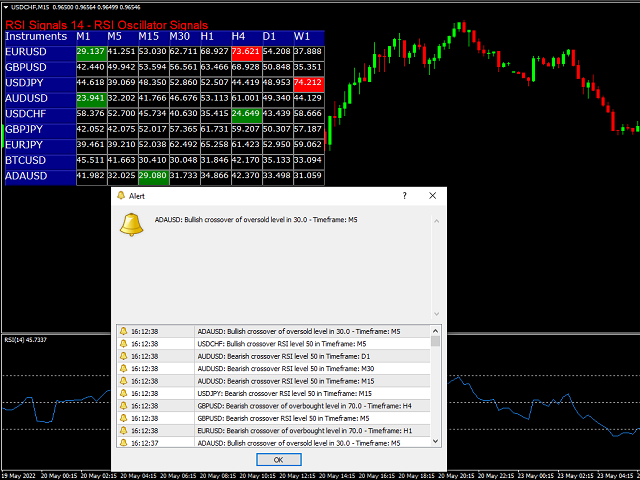
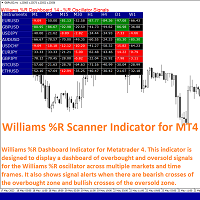
RSI Signals is a simple dashboard type indicator that displays the values of the RSI (Relative Strength Index) oscillator on various instruments and time frames chosen by the user. In addition, it can be configured by the trader to show signals when the RSI is in an overbought/oversold condition, when it crosses these levels or when it crosses the 50 level, which is important in some strategies. It is simple and easy to set up.
By itself, it should not be used as a trading system since RSI signals are not 100% reliable, as is the case with any technical indicator, but it is a useful support tool.
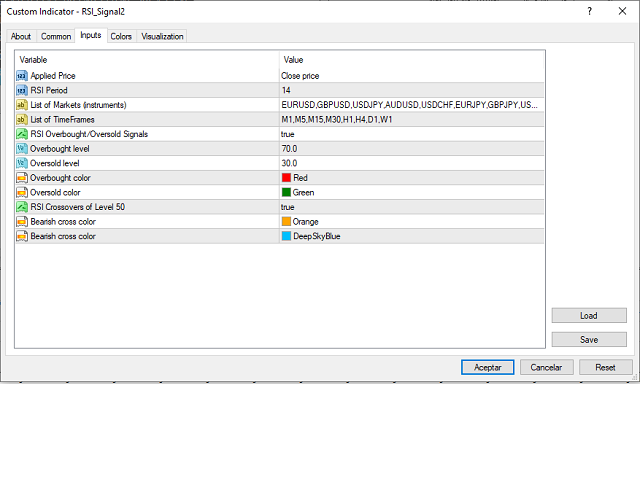
The parameters of this indicator are the following:
- Applied Price: This parameter allows to select the price type used in the calculation of the indicator. By default, the closing price is used.
- RSI period: It is the number of periods used in the calculation of the RSI. The default value is 14.
- List of Markets: Here the trader indicates the markets or currency pairs in which he wishes to calculate the RSI values. You can add as many pairs as the broker offers on the platform. By default, the indicator shows EURUSD, GBPUSD, USDJPY, and AUDUSD pairs.
- Time_frames: In this parameter, we can indicate in which time frames we want to calculate the RSI for each currency pair. We can aggregate all the time frames that MT4 offers. By default, the indicator displays the following timeframes M5, M15, M30, H1, H4, D1 and W1
- Overbought/oversold signals: In this last parameter we indicate if we want the dashboard to show overbought and oversold signals. By default, the value is False (do not display). If we want the signals to come out, we must select True.
- Overbought level: It is the level where the RSI reaches an overbought condition. It is taken as a bearish signal of the indicator. The default value is 70.
- Oversold level: It is the level where the RSI reaches an oversold condition. It is taken as a bullish signal of the indicator. The default value is 30.
- Overbought color: Used to set the color of overbought readings on the dashboard.
- Oversold color: Used to set the color of oversold readings on the dashboard.
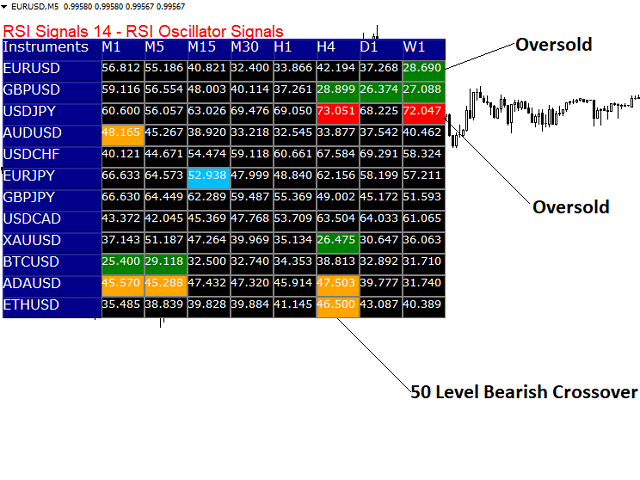
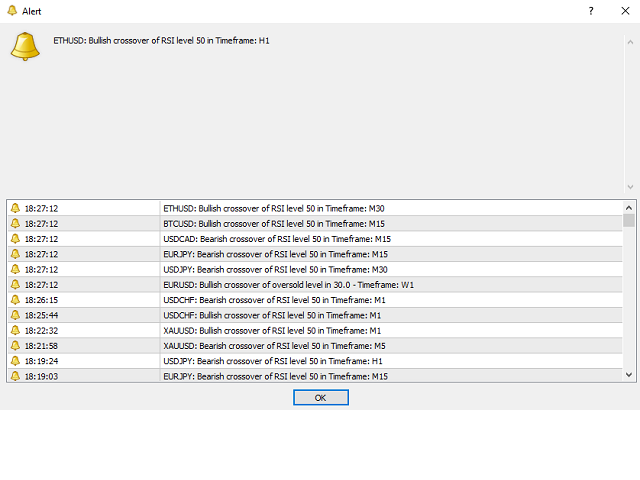
- RSI Crossovers of Level 50: In this parameter we indicate if we want the dashboard and the alert window to show signals of bullish and bearish crosses of the 50 level of the RSI. By default, the value is False (do not display). If we want the signals to come out, we must select True.
- Bearish cross color: Here we can set the color of the bearish crossovers of the RSI 50 level.
- Bullish cross color: Here we can set the color of the bullish crossovers of the RSI 50 level.
-To add new currency pairs in Markets, we write the symbol of the pair, for example, XAUUSD, without the “/” symbol and separated by a comma (no spaces).
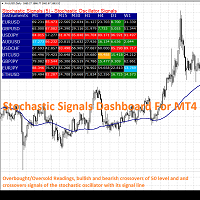
-Overbought and oversold signals are shown by changes in the color of the RSI boxes. When the RSI is in an overbought condition the box turns red and when it is oversold it turns green.






Muy util, y su creador muy amable con las dudas