RSI Dashboard Scanner
- Indicatori
- Teddy Mutugi Mworia Teddy Mutugi Mworia
- Versione: 2.0
- Aggiornato: 9 agosto 2022
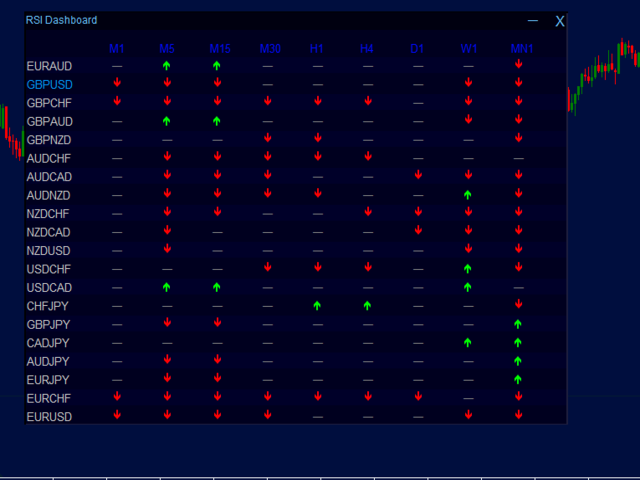
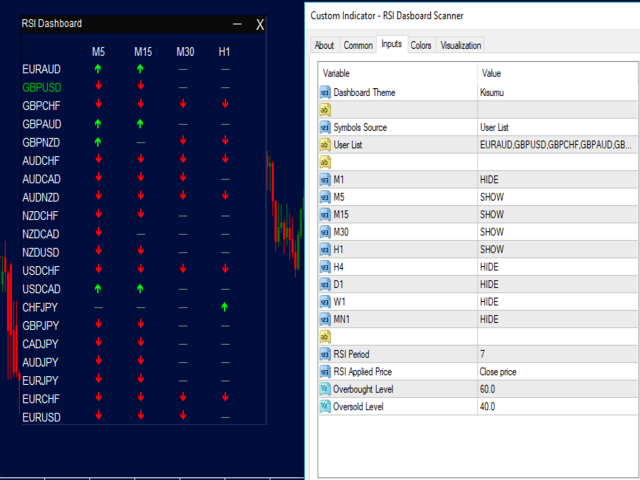
Questo indicatore esegue la scansione di più coppie su più intervalli di tempo per i valori RSI e disegna frecce verdi verso l'alto per i valori RSI ipercomprato e frecce rosse verso il basso per i valori RSI ipervenduto in tempo reale.
Caratteristiche
•Tracciatura di righe animate
•Ridimensionabile
•Riposizionabile
•Riducibile
•Temi dashboard multipli
•Tempi multipli
•È possibile aprire una coppia facendo clic su di essa
•Coppia di grafici attuali contrassegnata da un colore diverso
•Utilizzare le coppie di market watch o il proprio elenco di coppie
•Scegliere gli intervalli di tempo da visualizzare


Completely admirable! Good stuff, my respect to you!