RSI Pro Indicator
- Indicatori
- Pierce Vallieres
- Versione: 1.0
- Attivazioni: 20
RSI Pro Indicator
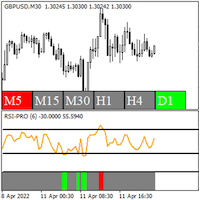
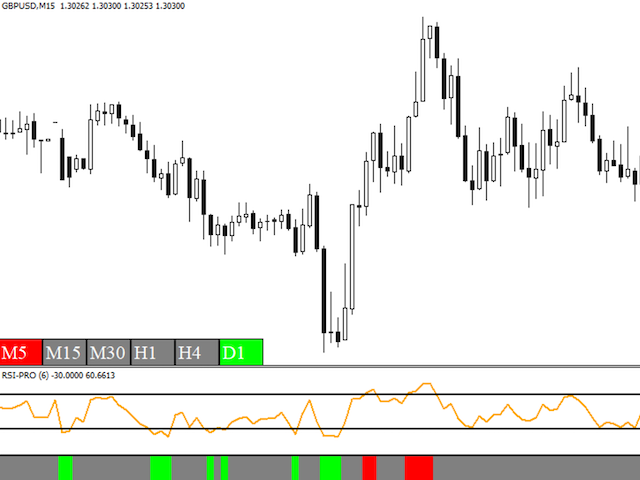
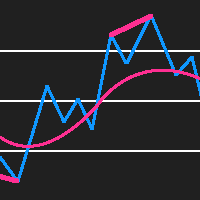
- Shows accurate RSI signals with modifiable price applications
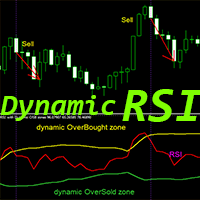
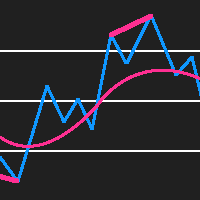
- Shows accurate RSI overbought and oversold levels
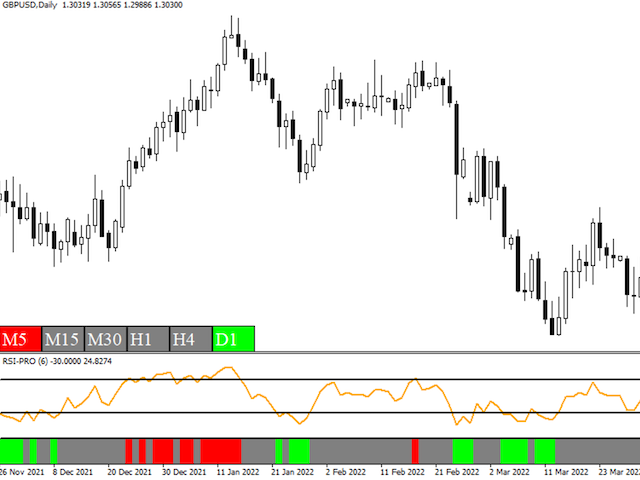
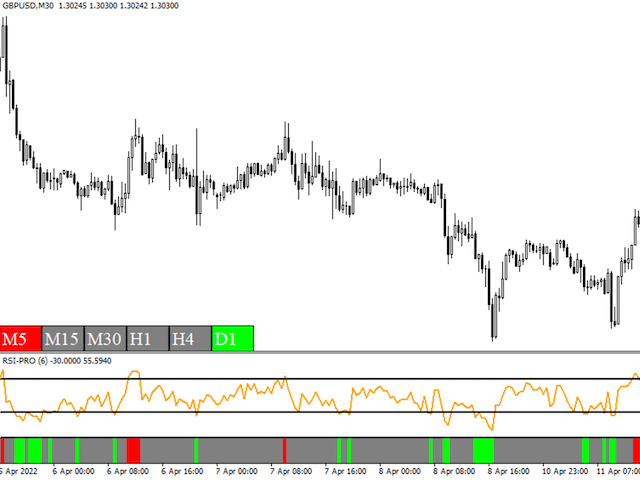
- Shows multiple timeframe RSI overbought and oversold conditions on a single chart
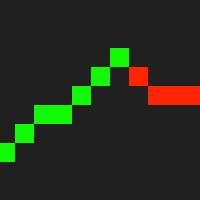
- 3 green bar sections in a row is an uptrend pattern
- 3 red bar sections in a row is a downtrend pattern
The RSI Pro Indicator is a highly useful tool for determining overbought and oversold conditions and spotting RSI patterns, as well as spotting overbought and oversold conditions across multiple timeframes simultaneously on a single chart.
