• Panoramica
  • Recensioni (10)
  • Commenti (42)
  • Novità

News impact

4.67

Choose the best trading tool: The impact of news on the exchange rate of a currency pair!

As a news source you can use: Terminal calendar or Investing.com website

In the second case, you will additionally need the Get News5 utility.

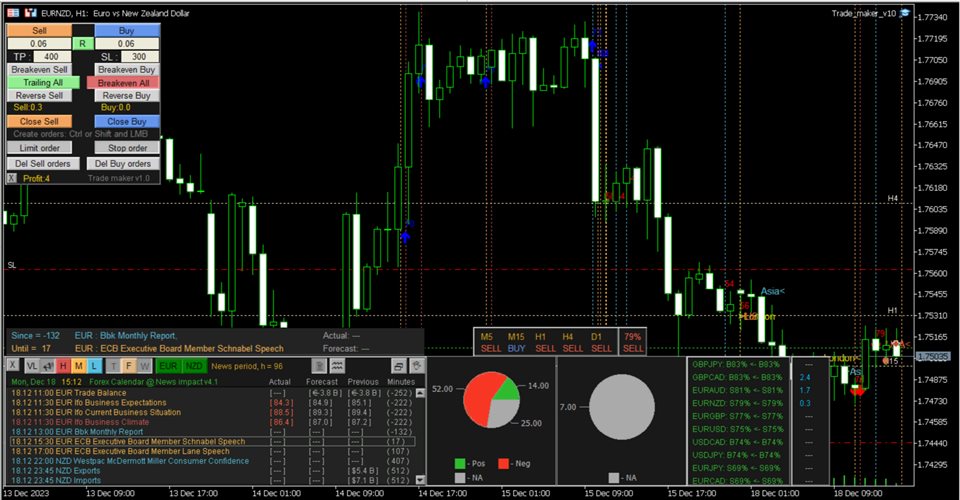
The indicator combines well with the Trade maker utility, providing multi-currency trading.

Calculates:

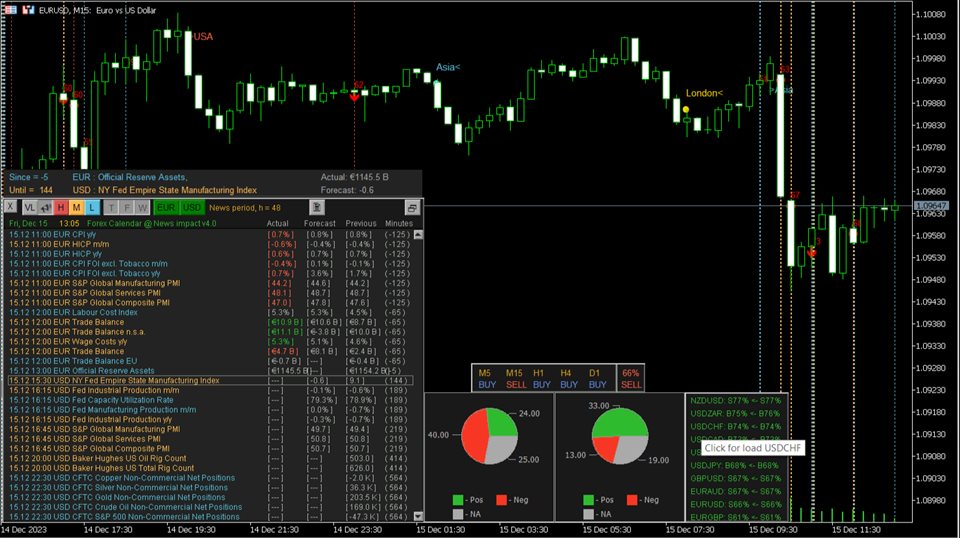
  • indices of the impact of current news on currency pairs, taking into account market expectations.
  • actual trend directions for 5 customizable timeframes and levels of change in trend direction
  • time elapsed since the publication of the next news and time remaining until the next one is published
  • writes a file with a news table in CSV format for the specified date interval
Current news values are analyzed based on their impact on the currency to which they relate.
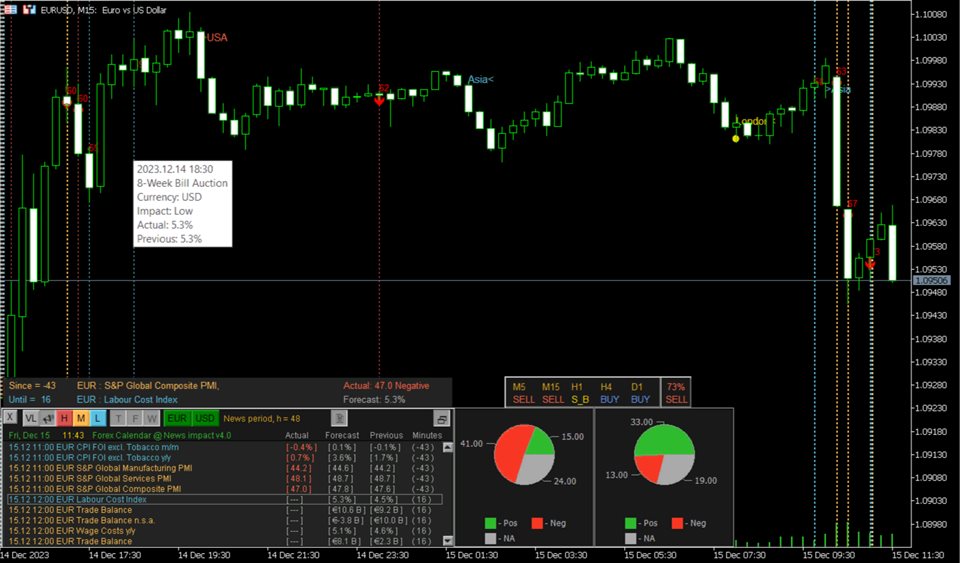
The published current value of the news has a characteristic impact on the currency it relates to: positive, negative, neutral . The indicator summarizes all these values for the selected period, taking into account the importance of the news: high, medium, low and displays it on a graph in the form of a pie chart.

This allows you to make a forecast of exchange rate movement if one symbol has more positive news and the other has more negative news.

Uses the built-in news calendar of the MT5 terminal and does not require additional settings.

The indicator selects news based on the chart symbol or the specified value of the Currency pair news parameter, plus displays analysis on 16 pairs.

The Low, Medium, High buttons set the news filter by importance.

The Now, Today, Week buttons set the depth of the period of looking back to calculate the impact of current news values.

The influence rating panel (appears by clicking on the corresponding button) analyzes 12 currency pairs: EURUSD, GBPUSD, AUDUSD, NZDUSD, USDJPY, USDCHF, USDCAD, EURGBP, EURJPY, EURCAD, GBPJPY, plus the one to which the indicator is attached.

To change the news of the current currency pair to the news of another currency pair, just click on the corresponding line of the influence rating panel.

Allows you to find a currency pair whose rate is more likely to move under the influence of news

On the right you can open an additional Trading panel showing profit for the symbols of a given Magic number for multi-currency trading

There is a sound notification about the occurrence of news in the form of the spoken word “News”.

Markers for the beginning and end of trading sessions are displayed on the chart:

  • London
  • New York
  • Tokyo

Vertical lines of news released at the same time will be displayed on the chart with some offset.

To do this, set Options->Charts->Precise time scale in the terminal

Can be attached to any chart with any time frame.

If you purchased my indicator:

  • Your wishes will be taken into account when developing new versions
  • Tell your friends about it, because if they buy it, it will develop and improve

Parameters

Has Scale and markup =100% parameter for adjusting the interface on high-resolution monitors (100%, 125%, 150%, 175%, 200%).

Currency pair news = ""; // The entered value is used to display news; if not specified, then the symbol of the current chart

The value of the news impact filter, % = 60; // If the value of the news impact index is greater than the specified value, the corresponding arrow is displayed on the chart

. . . . . . . . . .

Recensioni 10
Fabrizietto71
1088
Fabrizietto71 2024.04.16 02:35 
 

The product is well and carefully made. The developer's assistance is always timely and present. It proves to be very useful to have an overview regarding events that are upcoming. Very satisfied. We also optimized some settings together. I would add that Aleksander is always available and ready to make further improvements and changes.

220072256
4046
220072256 2024.03.08 12:59 
 

This fantastic news indicator is a staple of my trading

Matthew Phillip Clarke
315
Matthew Phillip Clarke 2023.12.08 10:08 
 

This tool has improved my trading so much, as now I am not wasting my time in markets that are too volatile during news times, it's the first template I open in the day before trading.

Prodotti consigliati
ToolBox 360 is the swiss knife of all indicators. It is full packed with useful tools to help you with your trading. It can be used to find best entry and exit points and help you to decide if you should open a trade or not. It shows market trends, candlestick formations outside / inside bars and you can sett time based allerts. Main features: Time based Fibonacci lines Choose a start and end time and the indicator shows you Fibonacci lines within the selected time range including range high
The Beta index, also known as the Beta indicator, is one of the key reference indicators for hedging institutions. It allows you to measure the relative risk of individual assets, such as currencies and commodities, in comparison to market portfolios, cross-currency pairs, the U.S. dollar index, and stock indices. By understanding how your assets perform in relation to market benchmarks, you will have a clearer understanding of your investment risk. Key Features: Accurate Risk Assessment: The Be
This product is designed for the MT5 platform and offers two key features: VWAP (Volume Weighted Average Price) calculation and Volume Profile analysis. Advantages: VWAP Calculation: The product calculates the VWAP, which is a popular indicator used by traders to determine the average price of a security based on its trading volume. It helps identify potential buying or selling opportunities by comparing the current price to the average price weighted by volume. Volume Profile Analysis: The prod
RAD CRITICAL LEVES RAD indicator tracks “Relevant Volume” in real time, identifying accumulation and distribution processes, projecting them in the chart as SUPPORT or RESISTANCE zones. Natural   support   and resistance levels are generated by Volume Accumulation and Distribution processes. As these processes evolve, levels at which the relevant volume in the market place is positioned, become difficult areas to cross upwards or downwards. By using this information, traders can identify very s
To download MT4 version please click here . - This is the exact conversion from TradingView: "Linear Regression Candles" By "ugurvu". - The overall look of the indicator is like Heiken Ashi. - It can be used as a trend confirmation indicator to detect the right trend direction. - This indicator lets you read the buffers for Candles' OHLC. - This is a non-repaint and light processing load indicator - You can message in private chat for further changes you need. Thanks
Tik Tok
Ivan Simonika
The Tik Tok indicator was created on the basis of the original extreme search indicators, the indicator is well suited for determining a reversal or a big sharp jerk in one direction, thanks to it you will know when this happens it will notify you when a blue dot for buying red for sale appears. It basically uses the process of detecting the rate of change in price growth and allows you to find entry and exit points from the market. fundamental technical indicator that allows you to assess th
VWAP Indicator MT5
Kyra Nickaline Watson-gordon
Description : VWAP (Volume-Weighted Average Price) is the ratio of the value traded to total volume traded over a particular time horizon. It is a measure of the average price at which pair is traded over the trading horizon. Read More. All Symbols and All Timeframes are supported. Indicator Inputs :     VWAP Mode : Mode of VWAP Calculation. Options can be selected : Single,Session,Daily,Weekly,Monthly     Volumes : Real Volumes,Tick Volumes     Price Type : Used price for cal
RSIScalperPro
PATRICK WENNING
Introducing RSIScalperPro - the revolutionary RSI-based indicator for Metatrader 5, specifically designed for scalping in the one-minute chart. With RSIScalperPro, you'll have a powerful toolkit for precise entry and exit signals to take your trading to the next level. RSIScalperPro utilizes two different RSI indicators that provide clear signals for overbought and oversold areas. You can customize the time periods and limit values of the two RSIs according to your preferences to achieve the be
Hello ! If you scroll in one chart, all charts will be scrolled If you change the time frame in one chart, it will change in all charts Of course, you can turn this feature on or off All the charts in which you want changes to be applied are specified through ID in the indicator settings You can scroll the charts of different time frames in two ways at the same time 1: Coordinated based on time That is, 1 hour candle is 60 candles one minute back 2: scroll in the form of number of candles That i
White Weis Volume Ticks
Ricardo Almeida Branco
5 (4)
White Weis Volume This indicator shows the sum of the volume in each wave, bulish or bearish, as idealized by David Weis , but it brings an important addition , which is the marking of the bar with the highest volume of the wave (White Bar)! In coding the indicator, it was sought to optimize the code to require minimal processing during use and not to overload mt5. The indicator can be used for pre-trading analysis and study, where the trader analyzes possible points of support and resi
Индикатор Magneto Weekly Pro отображает: Недельные важные линии поддержки и сопротивления (выделены желтым, красным и синим цветами). Основные недельные цели (выделены белым цветом). Недельные паттерны возврата цены (обозначаются красными флажками). Применение индикатора Magneto Pro можно использовать и как дополнение к существующей стратегии, и как самодостаточную торговую стратегию. Данный продукт состоит из двух индикаторов, работающих на разных временных промежутках, и предназначен для скал
VWAP Bands
Rafael Caetano Pinto
This indicator uses VWAP and projects this VWAP into up to 3 levels, shifted by a percentage of the chart's symbol. How to configure: Choose the symbol and desired graphic time Set the start time of the symbol (in bovespa, WIN and WDO start at 9 o'clock). This time is used as the cutoff reference for VWAP. Check which VWAP period fits the chart better: Ideally, a period when VWAP is not too distant from the chart Set percentage levels: Ideally, you should set levels based on history, so that l
Questo indicatore si basa sulla trasformata discreta di Hartley. L'utilizzo di questa trasformazione consente di applicare approcci diversi durante l'elaborazione di serie temporali finanziarie. Una caratteristica distintiva di questo indicatore è che le sue letture si riferiscono non a un punto del grafico, ma a tutti i punti del periodo dell'indicatore. Durante l'elaborazione di una serie storica, l'indicatore consente di selezionare vari elementi della serie storica. La prima possibilità di
Adjustable Consecutive Fractals  looks for 2 or more fractals in one direction and sends out a on screen alert, sound alert and push notification, for strong reversal points . Adjustable Consecutive Fractals, shows the fractals on chart along with a color changing text for buy and sell signals when one or more fractals appear on one side of price. Adjustable Consecutive Fractals is based Bill Williams Fractals . The standard Bill Williams fractals are set at a non adjustable 5 bars, BUT withe
GRat Clusters  is an indicator that shows various data in the form of clusters on a price chart: volume, delta, ratio of sales and purchases, etc. It allows you to visually see the market profile in real time and on history at a given depth. Capabilities 1.8 types of cluster data: volume, delta, purchases   and sales , volume and delta, imbalance between sales and purchases , volume profile, delta profile, buy and sell profile. 2. A cluster period can be either any available in MT5 timeframe or
Session Volume Profile  is an advanced graphical representation that displays trading activity during Forex trading sessions at specified price levels. The Forex market can be divided into four main trading sessions: the Australian session, the Asian session, the European session and the favorite trading time - the American (US) session. POC  - profile can be used as a support and resistance level for intraday trading. VWAP  - Volume Weighted Average Price. ATTENTION  ! For the indicator to
When analyzing financial time series, researchers most often make a preliminary assumption that prices are distributed according to the normal (Gaussian) law. This approach is due to the fact that a large number of real processes can be simulated using the normal distribution. Moreover, the calculation of the parameters of this distribution presents no great difficulties. However, when applied to financial markets, normal distribution does not always work. The returns on financial instruments of
El indicador "Mega Spike Boom and Crash" es una herramienta diseñada para su uso en los índices sintéticos, específicamente en los pares Boom y Crash. Su propósito principal es identificar y trazar zonas que funcionan como niveles de soporte y resistencia en distintas temporalidades. La temporalidad mas recomendada para usar este indicador es en el marco de tiempo de 5 minutos  El precio de apertura de ( 1 H , 15 M , 30M )   horas  son los niveles de precios más importante del día. Representa
The Fat and Slim indicator tracks strong and weak money in the market. It is derived from RSI, MFI and many similar indicators. Input values are closing prices and volumes. The RSI (yellow curve) is in the range -100 ... 100. It is additionally multiplied by a coefficient so that the curve is not compressed to the middle values at higher periods (a problem with the classic RSI with different periods). Strong/Fat red curve is RSI weighted by higher volumes. Weak/Slim blue curve is calculated so t
Hi there! Since I am starting commercial and non-commercial product publishing I would highly appreciate: If you like this product, please rate it. That will help to promote not only this product, but indirectly another ones. So, such promotion will help to make some money from commercial products. Thus, I will have opportunity to fund my another directions of trading researches like bot development using mql4 and mql5 programming languages as well as python written products like crypto bots. If
DYNAMIC SR TREND CHANNEL Dynamic SR Trend Channel is a simple indicator for trend detection as well as resistance/support levels on the current timeframe. It shows you areas where to expect possible change in trend direction and trend continuation. It works with any trading system (both price action and other trading system that use indicators) and is also very good for renko charting system as well. In an uptrend, the red line (main line) serves as the support and the blue line serves as the
Unlock the power of Fibonacci with our advanced indicator! This tool precisely plots Fibonacci levels based on the previous day's high and low, identifying the next day's key support and resistance levels. Perfect for day trading and swing trading, it has consistently generated weekly profits for me. Elevate your trading strategy and seize profitable opportunities with ease. NOTE: In the Input section make sure the draw labels are set to "True" so you can see each levels.
Rejection Block
Usiola Oluwadamilol Olagundoye
The "Rejection Block" MetaTrader 5 Indicator offers traders a comprehensive tool for identifying and visualizing rejection candlestick patterns, commonly known as rejection blocks. These patterns are pivotal in discerning potential market reversals or continuations, making them invaluable for traders seeking to enhance their analysis. Key Features: Rejection Block Detection: The indicator diligently scans price data, pinpointing instances of rejection candlestick patterns. These patterns typical
FREE
Visual guide which divides the 24 hours into three trading sessions. The default setting is to show Asian , London and New York sessions. But, the session start and end hours can be adjusted as required.  The indicator is useful to develop trading strategies by making it easy to see the market behavior during the three sessions.  Inputs Time Zone Start and End hours (Please provide values in HH:MM format, like 02:00, not like 2:00. Both the hours and minutes should have 2 digits) Time zone
Introducing the "Bull vs Bear Price Strength Oscillator" Indicator: Your Key to Smart Trading Decisions! Are you looking for a trading tool that can provide you with a clear and visual representation of price trend strength? Look no further! The Price Strength Indicator is here to transform the way you analyze the markets and make trading decisions. Uncover Hidden Market Strength: The Price Strength Indicator is designed to help you assess the market's momentum with ease. It does this by evaluat
Value Chart Candlesticks
Flavio Javier Jarabeck
4.7 (10)
The idea of a Value Chart indicator was presented in the very good book I read back in 2020 , " Dynamic Trading Indicators: Winning with Value Charts and Price Action Profile ", from the authors Mark Helweg and David Stendahl. The idea is simple and the result is pure genius: Present candlestick Price analysis in a detrended way! HOW TO READ THIS INDICATOR Look for Overbought and Oversold levels. Of course, you will need to test the settings a lot to find the "correct" one for your approach.
FREE
Do you use volume in your reading of the market? Certainly many traders use it, and do not imagine operating without it. The Color Histogram Volume Set indicator allows the user to choose the value that he considers interesting to monitor. When you pass this you will have visual confirmation and if you want you will also have the audible alert that is given by the indicator. Of course, there are other ways to try to find a high volume, such as assessing whether the volume
Intraday Vwap Orion
Joao Paulo Botelho Silva
Theory VWAP is a volume-weighted moving average, bringing greater relevance to prices. The VWAP base calculation follows the classic formula described in Investopedia ( https://www.investopedia.com/terms/v/vwap.asp ). VWAP = sum(typical price[i]*volume[i]) / sum(volume[i]) Functionalities Orion Intraday VWAP innovates by allowing the user to choose between the conventional Daily, Weekly and Monthly periods, also having the option of calculating the Intraday indicator, as used in other platfo
VWAP with more settings
Maria Cristina Sabatini
I developed this vwap with more settings in order to be customized as much as possible.  VWAP is a really strong indicator for your trading. It can be used to check if the market is in balance or ranged, and also you can use the levels as support/resistence/target.  In the pictures you can see the main settings, and you can select the use of real volume from the broker. Hope you will find it useful. Many thanks in advance.  
This Indicator adding power to traditional zigzag indicator. With High-Low numbers in vision it will be easier to estimate change of trend by knowing the depth of each wave. Information including points, pips, percentage%, and #bars can be displayed based on configuration. All information is real-time update. This indicator is especially useful in sideway market to buy low sell high.
Gli utenti di questo prodotto hanno anche acquistato
TPSproTREND PrO MT5
Roman Podpora
4.9 (10)
TPSpro TREND PRO   è un indicatore di tendenza che analizza automaticamente il mercato, fornisce informazioni sulla tendenza e sui rispettivi cambiamenti e fornisce segnali per entrare nelle operazioni senza ridisegnare. L'indicatore utilizza ciascuna candela e la analizza separatamente. Si riferisce a vari shock al rialzo o al ribasso. Punto di ingresso preciso per il trading di valute, criptovalute, metalli, azioni e indici! Versione MT5                   Descrizione completa dell'indicatore
TPSpro RFI Levels MT5
Roman Podpora
4.75 (12)
ISTRUZIONI       RUS   -   INGLESE       Si   consiglia di utilizzare con un indicatore       -       TPSpro   TENDENZA PRO -   Versione MT4         Un elemento chiave nel trading sono le zone o i livelli da cui vengono prese le decisioni di acquisto o vendita di uno strumento di trading. Nonostante i tentativi dei principali attori di nascondere la loro presenza sul mercato, lasciano inevitabilmente delle tracce. Il nostro compito era imparare a identificare queste tracce e interpretarle corre
FX Levels è un indicatore di supporto e resistenza eccezionalmente accurato che fonde il tradizionale metodo Lighthouse con un approccio dinamico innovativo, funzionando perfettamente su tutti i simboli di trading. Si tratta di coppie di valute, indici, azioni o materie prime. FX Levels identifica i punti di inversione e li visualizza sul grafico, che possono essere utilizzati come obiettivi di profitto nelle vostre attività di trading. Nello sviluppo di FX Levels, abbiamo sfruttato la nostra v
Quantum TrendPulse
Bogdan Ion Puscasu
5 (1)
Ecco   Quantum TrendPulse   , lo strumento di trading definitivo che combina la potenza di   SuperTrend   ,   RSI   e   Stocastico   in un unico indicatore completo per massimizzare il tuo potenziale di trading. Progettato per i trader che cercano precisione ed efficienza, questo indicatore ti aiuta a identificare con sicurezza le tendenze di mercato, i cambiamenti di momentum e i punti di entrata e uscita ottimali. Caratteristiche principali: Integrazione SuperTrend:   segui facilmente l'andame
Atomic Analyst MT5
Issam Kassas
4.32 (19)
Innanzitutto, vale la pena sottolineare che questo indicatore di trading non è repaint, non è ridisegno e non presenta ritardi, il che lo rende ideale sia per il trading manuale che per quello automatico. Manuale utente: impostazioni, input e strategia. L'Analista Atomico è un indicatore di azione del prezzo PA che utilizza la forza e il momentum del prezzo per trovare un miglior vantaggio sul mercato. Dotato di filtri avanzati che aiutano a rimuovere rumori e segnali falsi, e aumentare il pote
FX Power MT5 NG
Daniel Stein
5 (7)
Ricevi il tuo aggiornamento quotidiano sul mercato con dettagli e schermate tramite il nostro Morning Briefing qui su mql5 e su Telegram ! FX Power MT5 NG è la nuova generazione del nostro popolare misuratore di forza delle valute, FX Power. Cosa offre questo misuratore di forza di nuova generazione? Tutto ciò che avete amato dell'FX Power originale IN PIÙ Analisi della forza di ORO/XAU Risultati di calcolo ancora più precisi Periodi di analisi configurabili individualmente Limite di calcolo pe
Innanzitutto è importante sottolineare che questo sistema di trading è un indicatore Non-Repainting, Non-Redrawing e Non-Lagging, il che lo rende ideale sia per il trading manuale che per quello automatico. Corso online, manuale e download di preset. Il "Sistema di Trading Smart Trend MT5" è una soluzione completa pensata sia per i trader principianti che per quelli esperti. Combina oltre 10 indicatori premium e offre più di 7 robuste strategie di trading, rendendolo una scelta versatile per div
Matrix Arrow Indicator MT5
Juvenille Emperor Limited
5 (13)
Matrix Arrow Indicator MT5   è un trend unico 10 in 1 che segue un indicatore multi-timeframe al   100% non ridipinto   che può essere utilizzato su tutti i simboli/strumenti:   forex ,   materie prime ,   criptovalute ,   indici ,   azioni .  Matrix Arrow Indicator MT5  determinerà la tendenza attuale nelle sue fasi iniziali, raccogliendo informazioni e dati da un massimo di 10 indicatori standard, che sono: Indice di movimento direzionale medio (ADX) Indice del canale delle materie prime (CCI
PZ Swing Trading MT5
PZ TRADING SLU
5 (4)
Protect against whipsaws: revolutionize your swing trading approach Special Offer: Purchase now to receive free bonuses worth $135! (Read more for details) Swing Trading is the first indicator designed to detect swings in the direction of the trend and possible reversal swings. It uses the baseline swing trading approach, widely described in trading literature. The indicator studies several price and time vectors to track the aggregate trend direction and detects situations in which the market i
Presentazione       Quantum Breakout PRO   , l'innovativo indicatore MQL5 che sta trasformando il modo in cui scambi le zone di breakout! Sviluppato da un team di trader esperti con un'esperienza di trading di oltre 13 anni,       Quantum Breakout PRO       è progettato per spingere il tuo viaggio di trading a nuovi livelli con la sua strategia innovativa e dinamica della zona di breakout. Quantum Breakout Indicator ti fornirà frecce di segnalazione sulle zone di breakout con 5 zone target
FX Volume MT5
Daniel Stein
4.93 (14)
Ricevi il tuo aggiornamento quotidiano sul mercato con dettagli e schermate tramite il nostro Morning Briefing qui su mql5 e su Telegram ! FX Volume è il PRIMO e UNICO indicatore di volume che fornisce una visione REALE del sentiment del mercato dal punto di vista del broker. Fornisce informazioni straordinarie su come gli operatori di mercato istituzionali, come i broker, sono posizionati sul mercato Forex, molto più velocemente dei rapporti COT. Vedere queste informazioni direttamente sul vo
Top indicator for MT5   providing accurate signals to enter a trade without repainting! It can be applied to any financial assets:   forex, cryptocurrencies, metals, stocks, indices .  Watch  the video  (6:22) with an example of processing only one signal that paid off the indicator! MT4 version is here It will provide pretty accurate trading signals and tell you when it's best to open a trade and close it. Most traders improve their trading results during the first trading week with the help of
Ora $ 147 (aumentando a $ 499 dopo alcuni aggiornamenti) - account illimitati (PC o MAC) Manuale utente di RelicusRoad + Video di formazione + Accesso al gruppo Discord privato + Stato VIP UN NUOVO MODO DI GUARDARE IL MERCATO RelicusRoad è l'indicatore di trading più potente al mondo per forex, futures, criptovalute, azioni e indici, fornendo ai trader tutte le informazioni e gli strumenti di cui hanno bisogno per rimanere redditizi. Forniamo analisi tecniche e piani di trading per aiutar
Blahtech Supply Demand MT5
Blahtech Limited
4.54 (13)
Was: $299  Now: $99   Supply Demand uses previous price action to identify potential imbalances between buyers and sellers. The key is to identify the better odds zones, not just the untouched ones. Blahtech Supply Demand indicator delivers functionality previously unavailable on any trading platform. This 4-in-1 indicator not only highlights the higher probability zones using a multi-criteria strength engine, but also combines it with multi-timeframe trend analysis, previously confirmed swings
La soluzione migliore per ogni principiante o trader esperto! Questo indicatore è uno strumento di trading unico, di alta qualità e conveniente perché abbiamo incorporato una serie di caratteristiche proprietarie e una nuova formula. Con un solo grafico è possibile leggere la forza delle valute per 28 coppie Forex! Immaginate come migliorerà il vostro trading perché sarete in grado di individuare l'esatto punto di innesco di una nuova tendenza o di un'opportunità di scalping? Manuale d'uso:
IX Power MT5
Daniel Stein
4.17 (6)
IX Power   porta finalmente l'imbattibile precisione di FX Power ai simboli non-Forex. Determina con precisione l'intensità delle tendenze a breve, medio e lungo termine dei vostri indici preferiti, azioni, materie prime, ETF e persino criptovalute. Potete   analizzare tutto ciò che   il vostro terminale ha da offrire. Provatelo e sperimentate come   il vostro tempismo migliori significativamente   durante il trading. Caratteristiche principali di IX Power Risultati di calcolo precisi al
Quantum Trend Sniper
Bogdan Ion Puscasu
4.71 (49)
Presentazione       Quantum Trend Sniper Indicator   , l'innovativo indicatore MQL5 che sta trasformando il modo in cui identifichi e scambi le inversioni di tendenza! Sviluppato da un team di trader esperti con un'esperienza di trading di oltre 13 anni,       Indicatore Quantum Trend Sniper       è progettato per spingere il tuo viaggio di trading verso nuove vette con il suo modo innovativo di identificare le inversioni di tendenza con una precisione estremamente elevata. *** Acquista Quant
Italo Trend Indicator MT5
Italo Santana Gomes
4.9 (10)
BUY INDICATOR AND GET EA FOR FREE AS A BONUS + SOME OTHER GIFTS! ITALO TREND INDICATOR  is the best trend indicator on the market, the Indicator works on all time-frames and assets, indicator built after 7 years of experience on forex and many other markets. You know many trend indicators around the internet are not complete, does not help, and it's difficult to trade, but the Italo Trend Indicator is different , the Italo Trend Indicator shows the signal to buy or sell, to confirm the signal t
Gold TMAF MTF - questo è il miglior indicatore tecnico azionario. L'algoritmo dell'indicatore analizza il movimento del prezzo di un asset e riflette la volatilità e le potenziali zone di ingresso. I migliori segnali dell'indicatore: - Per SELL = limite superiore rosso del TMA2 sopra il limite superiore rosso del TMA1 + indicatore frattale rosso sopra + freccia gialla del segnale SR nella stessa direzione. - Per BUY = limite inferiore blu di TMA2 sotto il limite inferiore blu di TMA1 +
TPA True Price Action indicator reveals the true price action of the market makers through 100% non-repainting signals strictly at the close of a candle! TPA shows entries and re-entries, every time the bulls are definitely stronger than the bears and vice versa. Not to confuse with red/green candles. The shift of power gets confirmed at the earliest stage and is ONE exit strategy of several. There are available now two free parts of the TPA User Guide for our customers. The first "The Basics"
Identify over 30 candlestick patterns with precision Special Offer: Purchase now to receive free bonuses worth $60! (Read more for details) This indicator recognizes over 30 Japanese Candlestick Patterns and highlights them beautifully on the chart. It is simply one of those indicators price action traders can't live without.  [ Installation Guide | Update Guide | Troubleshooting | FAQ | All Products ] Boost your technical analysis overnight Detect japanese candlestick patterns easily Trade
"The Squeeze indicator attempts to identify periods of consolidation in a market. In general the market is either in a period of quiet consolidation or vertical price discovery. By identifying these calm periods, we have a better opportunity of getting into trades with the potential for larger moves. Once a market enters into a "squeeze," we watch the overall market momentum to help forecast the market direction and await a release of market energy." The Modified TTM Squeeze Indicator is a modi
Was: $249  Now: $99   Market Profile defines a number of day types that can help the trader to determine market behaviour. A key feature is the Value Area, representing the range of price action where 70% of trading took place. Understanding the Value Area can give traders valuable insight into market direction and establish the higher odds trade. It is an excellent addition to any system you may be using. Inspired by Jim Dalton’s book “Mind Over Markets”, this indicator is designed to suit the
L'indicatore Quadrato di Gann è uno strumento potente di analisi di mercato basato sull'articolo "Formula Matematica per le Previsioni di Mercato" scritto da W.D. Gann. Questo strumento utilizza concetti matematici e teorie di Gann per effettuare un'analisi precisa del mercato. Utilizza i quadrati di 144, 90, 52 e anche il quadrato di 9. Inoltre, integra il metodo del  per il quadrato di 9 e la sua relazione con canali e modelli stellari di quel quadrato. Manuale Utente e Applicazione: Prima di
Gartley Hunter Multi
Siarhei Vashchylka
5 (8)
Gartley Hunter Multi - An indicator for searching for harmonic patterns simultaneously on dozens of trading instruments and on all possible timeframes. Manual (Be sure to read before purchasing) | Version for MT4 Advantages 1. Patterns: Gartley, Butterfly, Shark, Crab. Bat, Alternate Bat, Deep Crab, Cypher 2. Simultaneous search for patterns on dozens of trading instruments and on all possible timeframes 3. Search for patterns of all possible sizes. From the smallest to the largest 4. A
Volume Profile MT5
Mihails Babuskins
5 (3)
Contact me after payment to send you the User-Manual PDF File. Volume Profile Indicator A functional and useful tool that can improve your trading plan. This indicator calculates volume in price levels(typical volume indicator shows only candle volumes). With the volume of price levels, you can identify important areas that have the potential to reverse. You can also see the volume of support and resistance levels and decide on them. Using volume profiles along with   Price Action   and  
Trend Forecaster
Alexey Minkov
5 (6)
The Trend Forecaster indicator utilizes a unique proprietary algorithm to determine entry points for a breakout trading strategy. The indicator identifies price clusters, analyzes price movement near levels, and provides a signal when the price breaks through a level. The Trend Forecaster indicator is suitable for all financial assets, including currencies (Forex), metals, stocks, indices, and cryptocurrencies. You can also adjust the indicator to work on any time frames, although it is recommen
Trade double tops and bottoms effectively The PZ Double Top/Bottom Indicator is a technical analysis tool that helps traders identify potential price reversal patterns in the market. These patterns, known as double tops and bottoms, are characterized by two consecutive peaks or valleys in the price of an asset. Double tops and bottoms are often seen as potential reversal patterns because they can signal a change in the direction of the current trend. [ Installation Guide | Update Guide | Troub
PZ Cup and Handle MT5
PZ TRADING SLU
4 (1)
Increase trade accuracy with the time-tested cup and handle patterns The Cup and Handle pattern is a technical price formation that resembles a cup and handle, where the cup is in the shape of a "U" and the handle has a slight downward drift. The right-hand side of the pattern -the handle- is smaller than the left-hand side -cup-, and retraces no more than 50% from the top. It can be both a continuation and a reversal pattern.  [ Installation Guide | Update Guide | Troubleshooting | FAQ | All P
Currency Strength Meter is the easiest way to identify strong and weak currencies. This indicator shows the relative strength of 8 major currencies + Gold: AUD, CAD, CHF, EUR, GBP, JPY, NZD, USD, XAU. Gold symbol can be changed to other symbols like XAG, XAU etc. By default the strength value is normalised to the range from 0 to 100 for RSI algorithm: The value above 60 means strong currency; The value below 40 means weak currency; This indicator needs the history data of all 28 major currency
Altri dall’autore
Trends and News
Aleksander Gladkov
5 (1)
With the Trend and News indicator you will always be up to date! Tells you in which direction it is safer to open positions 3 in 1: trends + news + news influence index news for the selected period actual trends for five timeframes (M5, M15, H1, H4, D1 by default) news impact index calculated by assessing the actual values of published news News Displayed on the chart as vertical lines with a description in the form of a tooltip The text displays two news: the previous published and the ne
GS smart
Aleksander Gladkov
5 (1)
Best price, read GS smart channel ! 1 copy left for $185. Next price --> $250 Traders who purchase GS smart receive a personal bonus. After purchase contact me for assistance GS smart is 3 in 1 = Superior Grid Expert Advisor + News feed + Trend indicator. (for MT5: GS smart5 ) Live results for Gold trading can be viewed here . You don't need to follow the trend, the EA uses the trend indicator in the trading algorithm. Automatically adjusts its parameters to work on any Forex instrument (in
News impact L
Aleksander Gladkov
Uses the built-in news calendar of the MT5 terminal or the Investing.com website (in the latter case, the Get news5 utility is required) Has the Scale parameter={100%, 110%, 125%, ...} to adjust the comfortable size of the text and control elements Tells you in which direction it is safer to open positions 3 in 1: news + trends + news impact index news for the selected period: current and in tabular form actual trends for 5 customizable timeframes and trend reversal levels forecast of exc
GS trendS
Aleksander Gladkov
GS trendS is a trend indicator that can be used for any Forex financial instrument. The indicator does not redraw and does not lag. Recommended timeframe H1. It is possible to select the trend algorithm settings {Only Open, Average Open/Close, Average High/Low} The color indicates the direction of the trend: yellow - direction can be SELL or BUY (S_B) blue - uptrend (BUY) red - downward trend (SELL) The indicator panel displays trend values of 5 timeframes for the current price level.
Get news
Aleksander Gladkov
Utility for reading news from investing.com To access the site, you need to add WebRequest in the Options terminal menu on the Expert Advisors tab: https://sslecal2.investing.com If reading is successful, a message about writing the file is displayed. The INV_week_this.txt file is written to the MQL4\Files folder of the terminal and is kept up to date, updating data according to its own timer You can attach the utility to any chart with any time frame; one is enough to support indicators o
FREE
GS AssistDemo
Aleksander Gladkov
The demo version of GS Assist: only EURUSD, limited Lot, Profit and Loss parameters, the Members of Group panel has only two rows. The full version features a built-in Forex Factory news feed to allow closing orders before the news releases. GS Assist is designed for managing orders of other experts and risk exposure. It can run on all forex symbols. The tool can be used as an order manager for other experts and/or as a quick trading tool featuring BUY and SELL buttons. Features: Automatic closi
FREE
GS spread
Aleksander Gladkov
The indicator calculates the current spread for each tick using the formula Spread=(ASK-BID)/Point. Schedule of changes in the boundaries spread over the timeframe displayed in a separate window from the date of accession of the indicator. Two lines corresponding to the minimum and maximum spread values are displayed. The indicator window is self-adjusted according to the minimum and maximum values from the moment of launch. The minimum and maximum values for the entire period of the indicator o
FREE
GS Assist
Aleksander Gladkov
Advisor to manage all orders opened in the terminal. It is used as an administrator of open orders, setting them with Stop Loss and Take Profit, if they didn’t have such when creating them. It has a built-in news feed from Forex Factory for the ability to automatically close orders before the news is released. It can be attached to any currency pair, and will work with all open orders. Advisor provides: The installation of Stop Loss and Take Profit of all orders opened in the ter
GS grid
Aleksander Gladkov
5 (4)
Uses an advanced grid algorithm with no martingale or limited Martingale (default) (version for MT5: GS grid5 ) . Defines and control the current trend; It switches himself its parameters in accordance with the current market conditions ; Flexible customizable grid algorithm with or without martingale; Drawdown reduction algorithm (DD Reduction Algoritm); Hedge algorithm; Interactive trade control buttons; The ability to open / close orders manually; News filter to prevent trading during news
GS target
Aleksander Gladkov
5 (2)
The automatic adviser of the new generation with parameters: Target profit per month (10%, 25%, 50%, 75%, 100%) - choice of strategy Stop Loss Limit, USD Filter News Forex Factory (true, false) Parameters for setting the lot size Uses the news feed from Forex Factory to prevent trading during news releases. Set up to work on EURUSD timeframe M15. Works on USD accounts with a leverage from 1:500 and a Deposit from 500USD.   Enough for work: Decide on the size of the deposit that you can trust
GS Hero
Aleksander Gladkov
According to the trading algorithm GS Hero is similar to the best expert advisors on the Market. Unique GS Hero make the author's criteria for entering the market, the ability to close trades with maximum profit (in mode TakeMaximumProfit=true, the TargetProfit parameter sets only the required minimum profit) and the trading intensity: 4 orders per day and 75% with profit. GS Hero trades on the Heiken Ashi indicator in the direction of the trend, orders are filtered using RSI and MACD indicator
GS done
Aleksander Gladkov
Designed for the safe trading of instruments in the Forex market. DOES NOT use Martingale, Grid and other dangerous strategies. GS done Expert uses only pending orders on the broker's server, which reduces the risk Each trade has a fixed StopLoss For each currency pair, no more than one transaction can be executed Trades at specific business hours when the market is most stable using customizable time filters and a news feed Uses the search algorithm for the most favorable moment to enter
GS fast
Aleksander Gladkov
GS fast is fully autonomus automatic adviser, that includes very advanced indicators and the author's trading algorithm (for MT5 GS fast5 ). Trend Following, Counter Trend system , Level Trading algoritm and averaging are used. Properties: Built-in filter for news on interest rates of the FOMC and the ECB for 2021 Can trade with an initial deposit of 100USD The default settings are optimal for the EURUSD H1 currency pair Principle of operation Signals of the ATR RSI i4 indicator for opening
ATR RSI i4
Aleksander Gladkov
Composition of ATR and RSI indicators. The ATR RSI indicator compares two calculations of the ATR indicator with the Fast and Slow periods on one chart, plus the line of the average and the overbought and oversold zones of the RSI indicator. ATR shows the values of the volatility change in the currency pair in points, taking into account the period specified as a parameter. The entry points provided by the RSI indicator show a very good risk-reward ratio in volatile and trending markets. ATR
ATR RSI x4
Aleksander Gladkov
The Expert Advisor implements a trading strategy based on overbought and oversold zones of ATR RSI i4 indicator signals, which is included in the code . Trend Following, Counter Trend system , DD reduction Algoritm and Level Trading algoritm are used. To start trading, simply attach the EA to the chart, preferably EURUSD H1 timeframe. Live results can be viewed here . To trade with the new Forex instrument (EURUSD H1 by default), it is recommended to set up the parameter values by testing, initi
GS gold
Aleksander Gladkov
Best price! GS gold is 2 in 1 = Advanced Grid Expert Advisor + Trend Indicator. The algorithm is optimized for trading XAUUSD M5 (gold). Deposit from $5000 with a leverage of 1: 500 and above. GS gold can be used on any other Forex instruments with default settings. Smart Grid Algoritm, Trend Following, Counter Trend system, DD reduction Algoritm, Active Hedging Algoritm and averaging are used. Preset strategies (Use strategy parameter): No strategy Low profit Medium profit High profit
Gain since start
Aleksander Gladkov
It will perfectly complement your working Expert Advisor or manual trading with up-to-date information. There is a sound notification of exceeding the established profit and loss limits of open SELL and BUY orders. Moreover, for each currency pair EURUSD, GBPUSD, XAUUSD, and others, various sound alerts are activated in English. Results are displayed on a special panel on the chart from the moment the indicator is activated: Elapsed time Fixed profit Current profit SELL Current profit BUY M
GS Trend5
Aleksander Gladkov
This Expert Advisor has been developed for autonomous automatic trading on EURUSD M15 around the clock. It provides protection of the deposit from significant drawdown and the profitable trade saving mode. Trades using a single deal. With the default settings, it opens one deal per day on average. How it works It uses a proprietary algorithm that analyzes three indicators and the market direction to make a decision on opening a deal. RSI Stochastic Bands market movement direction It opens an o
GS grid5
Aleksander Gladkov
F ully automated Expert Advisor using the advanced grid algorithm and constrained Martingale (MT4 version: GS grid ). Set up to work on EURUSD timeframe M15. Test 2021 shows a high percentage of winning orders: more than 98%. Works on HEDGING accounts with a leverage of 1:500 and a Deposit from 1000USD. Can use the news feed from Forex Factory to prevent trading during news release (Filter News Forex Factory=true;). To access the options terminal menu on the Expert Advisors tab, you must enable
GS target5
Aleksander Gladkov
The revolutionary automatic adviser of the new generation with three parameters: Target profit per month (from 10% to 100%) Degree of risk (SuperLow, Low, Medium, High) Stop Loss Limit, USD Set up to work on EURUSD timeframe M15. Works on HEDGING accounts with a leverage of 1:500 and a Deposit from 500USD.   Enough for work: Decide on the size of the deposit that you can trust him Set the value of the desired profit per month (from 10 to 100 percent) Select the degree of risk (Low, Medi
GS fast5
Aleksander Gladkov
5 (1)
GS fast5 is a completely independent automated Expert Advisor that includes very advanced indicators and an author's trading algorithm (for MT4 GS fast ). Live results can be viewed here . Properties: Built-in filter for news on interest rates of the FOMC and the ECB for 2021 Can trade with an initial deposit of 100USD The default settings are optimal for the EURUSD H1 currency pair Principle of operation Signals of the Stochastic_MACD indicator for opening an order with appropriate sett
GS smart5
Aleksander Gladkov
5 (4)
Best price, read GS smart channel ! 3 copies left for $350. Next price --> $400 Traders who purchase GS smart5 receive a personal bonus. After purchase contact me for assistance Real-time Gold trading signal 24/7 https://www.mql5.com/en/signals/2264587 GS smart5 is 3 in 1 = Superior Grid Expert Advisor + News feed + Trend indicator. Automatically adjusts its parameters to work on any Forex instrument (including cryptocurrencies, indices and CFDs) for USD accounts. To start trading, simply a
It will perfectly complement your working Expert Advisor or manual trading with up-to-date information. There is a sound notification of exceeding the established profit and loss limits of open SELL and BUY orders. Moreover, for each currency pair EURUSD, GBPUSD, XAUUSD, and others, various sound alerts are activated in English. Indicators are displayed on a special panel on the chart from the moment the indicator is activated: Elapsed time Fixed profit Current profit Maximum drawdown Curr
GS one
Aleksander Gladkov
Try how the adviser trades, I'm sure you'll like it! Extremely easy to use, does not require additional settings. Unique dynamic grid algorithm with trend indicator and hedging. Works with all Forex currency pairs. Default parameters are configured for EURUSD M5 What can be a problem for other grid Expert Advisors GS one turns into profit. Has a set of strategies: Follow the trend Sell and Buy Only Sell Only Buy XAUUSD_M5 GBPUSD_H1   GS one has an intuitive interface for quick management of t
GS trade report
Aleksander Gladkov
5 (1)
3 in 1 : Report + monitoring + sending messages (Telegram, ...) to optimize trading and use of advisors. Monitoring: Panel on the chart Sending messages to Telegram Sending messages to Email Sending Notifications Sending pop-up messages Sound notifications when the established Profit/Loss levels are exceeded Monitoring is activated by pressing the Start button. Profit for the period by currency pairs, hours and Magic number for the current account. Forms four tables: by symbols, by magi
GS grid Pro
Aleksander Gladkov
The Expert Advisor works as quickly as possible using a minimum of resources, which is very good when using a VPS. Includes the latest grid algorithm implementation solutions: trend tracking separate automatic Breakeven for Sell and Buy series Active Hedging Algorithm during the trading process, sets Stop loss and Take profit for orders The default parameter settings do not use martingale. Works on all Forex instruments. Recommended: Deposit from $300 (only USD) with leverage from 1:500 Best r
A professional tool for real-time monitoring of the account status and the work of Expert Advisors. Information about the account status can be sent to Telegram chats automatically at a specified interval or upon request. From the screenshots of the open charts of the terminal, you receive upon request from your Telegram bot. Account information includes: 13:02 Trade monitoring by Telegram v.1.0 (headline) Account : 6802ххх RoboForex-Pro (account information) Profit start: 2661 USD (profit ear
Trade maker
Aleksander Gladkov
Multi-currency trading on one chart! Creation and management of positions with trailing and breakeven, risk management and other useful functions. To fix profits, the Target profit parameter is provided; if it is greater than zero, all positions will be closed if the set value is exceeded. All positions and orders have set Stop Loss and Take profit. For multi-currency trading, taking into account the impact of news and switching symbols on the chart, it is useful to use the News impact indicat
Bars news
Aleksander Gladkov
Indicator of news linked to a bar. The published current value of the news has a characteristic impact on the currency it relates to: positive, negative, neutral . The indicator summarizes all these values for the selected period, taking into account the importance of the news: high, medium, low . As a result, a percentage is calculated for the currency pair, which shows the news of which currency is dominant. If the value is positive, then the pair has news pressure towards BUY, if negative - S
Get news5
Aleksander Gladkov
Utility for reading news from investing.com To access the site, you need to add WebRequest in the Options terminal menu on the Expert Advisors tab: https://sslecal2.investing.com If reading is successful, a message about writing the file is displayed. The INV_week_this.txt file is written to the MQL5\Files folder of the terminal and is kept up to date, updating data according to its own timer You can attach the utility to any chart with any time frame; just one is enough to support indicat
Filtro:
Fabrizietto71
1088
Fabrizietto71 2024.04.16 02:35 
 

The product is well and carefully made. The developer's assistance is always timely and present. It proves to be very useful to have an overview regarding events that are upcoming. Very satisfied. We also optimized some settings together. I would add that Aleksander is always available and ready to make further improvements and changes.

Aleksander Gladkov
4989
Risposta dello sviluppatore Aleksander Gladkov 2024.04.16 09:18
Thank you, the review is very important to me.
220072256
4046
220072256 2024.03.08 12:59 
 

This fantastic news indicator is a staple of my trading

Aleksander Gladkov
4989
Risposta dello sviluppatore Aleksander Gladkov 2024.03.08 13:34
Thanks for the review. Hopefully a new opportunity to use the site's news Investing.com improve the quality of calculating the news impact index and it will be more adequate for the market.
Matthew Phillip Clarke
315
Matthew Phillip Clarke 2023.12.08 10:08 
 

This tool has improved my trading so much, as now I am not wasting my time in markets that are too volatile during news times, it's the first template I open in the day before trading.

CraigLeith
64
CraigLeith 2023.12.05 20:12 
 

Great utility. I especially like the vertical lines that show upcoming news.

Antonio Fluxa Vidal
2268
Antonio Fluxa Vidal 2023.11.30 18:38 
 

This indicator is an essential utility for FX trading based on fundamental analysis. I recommend it without a doubt. Its design integrated into the graph makes the great task of detecting trends based on future macroeconomic data much more precise and clear. A great job with many opportunities in the future!

Mohammed Mohammed Mohammed Abu Zaid
350
 

Very good and useful indicator.. I have one point though: - the values in the [Actual, Forecast and Previous] columns don't show the '%' mark, so I don't know if this value is in points or percentage... Also there are other symbols as "K & M" that don't show. Some times the value is (3.8K or 3.8M) but the indicator only shows (3.8) Hope you fix this soon...

Also, I think it might me a good idea to include multiple news sources like "investing.com" and "forexfactory" and let users choose either one through a settings option

Aleksander Gladkov
4989
Risposta dello sviluppatore Aleksander Gladkov 2024.02.12 15:54
In version 2.5, the display of news values in the table has been fixed. As for other news sources, I do not plan to connect such an opportunity. The fact that the indicator is self-sufficient and does not require external resources, drawing all the information from the terminal is an advantage. Using the sites will lead to a significant increase in traffic.
12.02.2024 The News impact L indicator can use the site's news investing.com
طاهر
76
طاهر 2023.05.02 16:13 
 

nah, I have bought this 2 days ago, and The JOLTS Job openeing today May second, was diffrent from investing.com, it actaully gave a positive sign for the USD yet the usd went down, lucky I wasn't depending on it.

Aleksander Gladkov
4989
Risposta dello sviluppatore Aleksander Gladkov 2024.03.08 13:23
Hi, the News impact indicator uses the economic calendar of the MQL5 website: https://www.mql5.com/en/economic-calendar , which is also available in the MT5 terminal on the Toolbox panel Calendar tab.
Calendar data is collected from public sources and the developer of this calendar, the MQL5 website, is responsible for them.
Non-compliance of individual calendar parameters with news from the site investing.com can be discussed on the forum https://www.mql5.com/en/forum or contact the support of the MQL5 website.
Website investing.com not the only source of the economic calendar. There is https://www.forexfactory.com/calendar and probably other sources. The data on each of them may differ.
What does the indicator do:
1. Takes data from the MQL5 calendar, selecting by currency pair symbols and binds them to the terminal time. The indicator is responsible for the compliance of the data published by it with the MQL5 calendar.
2. Generates a table of economic news values with the ability to set the viewing period (Today, 4 days, Week) and selection by importance (Low, Medium, High).
3. Displays vertical lines on the chart corresponding to the moment of the news release.
4. For the published value of Actual news in the calendar, an assessment of the compliance of the value with market expectations is set: Better than expected, Worse than expected, Neutral. This characteristic is emphasized by the color: green, red, gray.
The indicator collects these characteristics for a set period and generates a "news pressure index for the current quote".
For example, if there is more "good" news for EUR and less for USD for the EURUSD pair during the period, as well as "bad" news for USD add the EUR index and "bad" for EUR add the USD index.
As a result, the indicator shows the index value in the form of BUY and SELL percentages for a currency pair.
Moreover, the last panel shows two index values: for the current time interval and for the same previous one. This allows to assess the dynamics of changes in news pressure.
5. Pie charts show the weight of news falling into the index for a set period for each symbol.
6. It should be borne in mind that the market reacts to emerging economic news, but they are not the only factor affecting the rate of the currency pair.
7. I hope that having gained experience with my indicator, you will give it an adequate assessment.
Sincerely, good luck in trading. 12.02.2024 The News impact L indicator can use the site's news investing.com : https://www.mql5.com/en/market/product/107761 08.03.2024 News impact Version 5.0 allows you to select website Investing.com as a news source However, you will additionally need the Get News5 utility, since indicators cannot receive data from websites.
Barend Herculaas Christiaan Fourie
1005
 

L'utente non ha lasciato alcun commento sulla valutazione.

Aleksander Gladkov
4989
Risposta dello sviluppatore Aleksander Gladkov 2023.04.03 18:51
Thank you, user reviews and suggestions help to make my products become better
wuzzy66
921
wuzzy66 2023.03.17 21:50 
 

This is a game changer indicator this indicator gives a better picture of what is happening to a particular currency pair you all know the release of forex news has a great impact on the movement of the currency pair with this indicator also gives assessment taking into account market expectations, which certainly has an impact on the future movement of the currency pairyou trade with confidence you have a clear view how who is in controll in the market either the bulls or the bears you get all statistics that allows you to make quick inform decisions you also get vertical lines informing you of upcoming news that can impact you trade the concept is so good that you can make lots of pips I wish I had known about this indicator long ago but it's never to late to start trading with confidence was actually searching for an indicator that can inform me of future coming news and previous impact on news this a real game changer made over 100 pips using this the 1st day all you need is just take time to understand key statics shown on the chat very user friendly with lots of functionality wish I could give a 10 stars

Aleksander Gladkov
4989
Risposta dello sviluppatore Aleksander Gladkov 2023.03.18 09:15
Thank you, the indicator not only displays the news feed with the actual values, but also gives their assessment taking into account market expectations, which certainly has an impact on the future movement of the currency pair
Satbieter
251
Satbieter 2022.03.27 09:42 
 

Very good indicator. Support is very good and suggestions are implemented quickly.

Rispondi alla recensione
Versione 5.5 2024.06.03
1. The management of labels for levels of trend direction change has been adjusted
2. The operation of the X button has been corrected
3. Fixed the audio notification of the news publication.
4. The Custom sound file parameter has been added. The file must be located in the terminal directory\Sounds. Only WAV audio files are played.
Versione 5.4 2024.05.10
1. The Display Local time parameter = true; (by default) switching the displayed time from terminal to local
2. Added the Trend calc mode=Average value of the span Min/Max; (by default) parameter
Versione 5.3 2024.04.08
1. The terminal time display has been adjusted
2. Added the Display Local time = false; parameter switching the displayed time to local
Versione 5.2 2024.03.15
Access to the Investing.com news file has been adjusted
Versione 5.1 2024.03.10
1. The work with the Investing.com site has been corrected
2. Fixed the display of the news impact index values on the chart
Versione 5.0 2024.03.08
1. Added the ability to select a news source: terminal calendar or website Investing.com (News source parameter)
To access the site, you will need the Get News5 utility: https://www.mql5.com/en/market/product/110468
and terminal setup: Allow WebRequest for News from investing.com : Tools->Options->Expert Advisors Add=https://sslecal2.investing.com
2. The trend indicator has been improved and optimized
Versione 4.7 2024.02.26
1. The column of the news impact index for the previous period in the right symbols panel is excluded
2. Corrected the display of the pie chart when switching it
Versione 4.6 2024.02.14
The algorithm for changing the timeframe or symbol has been adjusted
Versione 4.5 2024.01.01
1. The Allow change symbol mode has been adjusted
2. Added a button to control the chart display
Versione 4.4 2023.12.25
Fixed the setting for saving the indicator modes
Versione 4.3 2023.12.22
Fixed the output of trend levels
Versione 4.2 2023.12.19
1. Added the parameter allowing/prohibiting overloads the graph symbol : Allow change symbol = false;
2. Button for recording .CSV news file has been added
3. Added File Start Time and File End Time parameters
Versione 4.1 2023.12.18
1. Clicking on the right panel overloads the chart symbol to the selected one and updates all indicator data
2. Added output to the chart of trend direction change levels for each of the five indicators
3. Added a panel with information about the profit of open positions by the symbols of the specified Magicnumber
Versione 4.0 2023.12.15
When switching symbols using the right panel, the data of trend indicators is updated
Versione 3.9 2023.12.12
1. Redesigned interface
2. Five customizable trend indicators have been added
3. Fixed scrolling of news in the table
4. Fixed the multiplicity of displaying vertical lines of future news
Versione 3.8 2023.12.09
1. The terminal remembers the indicator settings when changing the timeframe
2. The indicator has been switched to the terminal timer
Versione 3.7 2023.12.03
Added the Scale and markup parameter = 100% (default)
Versione 3.6 2023.12.02
Fixed the display of vertical lines
Versione 3.5 2023.12.02
A filter has been made for symbols with a dot in the name
Versione 3.4 2023.11.14
1. The Start time offset to the past parameter is set in hours
2. Optimized the output of vertical news lines
Versione 3.3 2023.10.29
1. Corrected the output of the current news values
2. Added VL button (Hide/Show vertical news lines on the chart)
3. The operation of the X button has been corrected (Show/Hide the indicator)
4. The parameters of the trend indicator panel have been changed
Versione 3.2 2023.10.16
Added the Hide the Trend panel = false parameter;
Versione 3.1 2023.10.12
Added trend indicator for two timeframes and its parameters
Versione 3.0 2023.10.08
Corrected the output of information to the current news panel
Versione 2.9 2023.10.04
1. Added a panel for displaying information about the current past and next news
2. Added output to the schedule of the start and close of trading sessions (London, New York, Tokyo)
3. Added a parameter that allows you to display news on the chart determined by the parameter value (convenient for indexes)
4. Added parameters:
Currency pair news = ""; //The entered value is used to display news, if not specified, then the symbol of the current chart
Show current panel = true;//panel for displaying information about the current past and next news
Show trading sessions = true; //Displays labels for the beginning and end of trading sessions (London, New York, Tokyo)
Versione 2.8 2023.09.28
1. Added parameters:
Show signal arrows = true;
The size of the arrows on the chart = 2;
Show the signal value = true;
Signal Font size = 9;
2. Changed default parameter values
3. Renamed the parameter Limit the impact of news, % to The value of the news impact filter, %
Versione 2.7 2023.09.09
1. In the terminal, set Options->Charts->Precise time scale
2. Vertical lines of news coming out at the same time will be displayed on the chart with some offset
3. The vertical line of the future next news is displayed on the chart to the right of the current time
4. Added Setting Ray parameter of vertical lines = false;
Versione 2.6 2023.08.13
1. Vertical news lines on the chart remain after clicking the hide "X" button, if the Show vertical lines parameter = true;
2. The actual value of the news with the characteristic of impact has been added to the hint of the vertical line
Versione 2.5 2023.07.20
Fixed the display of news values in the table.
Versione 2.4 2023.04.03
Added parameters: Always show USD news=false; и Include USD Low news=false;
Versione 2.3 2023.02.23
Fixed the error of "disappearing" the Hide button when expanding the news list
Versione 2.2 2023.02.21
1. Hide news/Show news button added
2. The pie chart panel has been corrected
Versione 2.1 2022.12.05
The interface has been corrected
Versione 2.0 2022.09.04
Added a filter by currency pair symbols
Versione 1.9 2022.04.25
Added the Show vertical lines parameter
Versione 1.8 2022.04.16
Fixed the output of vertical lines marking news events on the graph
Versione 1.7 2022.03.27
Added the ability to scroll the news table
Versione 1.6 2022.03.25
Added the ability to switch a currency pair by clicking on the row of the ratings panel of the impact of preset pairs
Versione 1.5 2022.03.24
Values for the current and previous periods have been added to the news impact results panel by the list of symbols
Versione 1.4 2022.03.23
1. Added font settings
2. Added the parameter of the maximum number of rows in the viewport
Versione 1.3 2022.03.22
Added a panel of resulting estimates of the impact of news on 10 currency pairs
Versione 1.2 2022.03.21
Added the resulting assessment of the impact of news on the currency pair: BUY and SELL as a percentage
Versione 1.1 2022.03.20
Fixed bugs