Multiple Charts Object Sync
- Indicatori
- Nguyen Thanh Sang
- Versione: 1.30
- Aggiornato: 17 marzo 2022
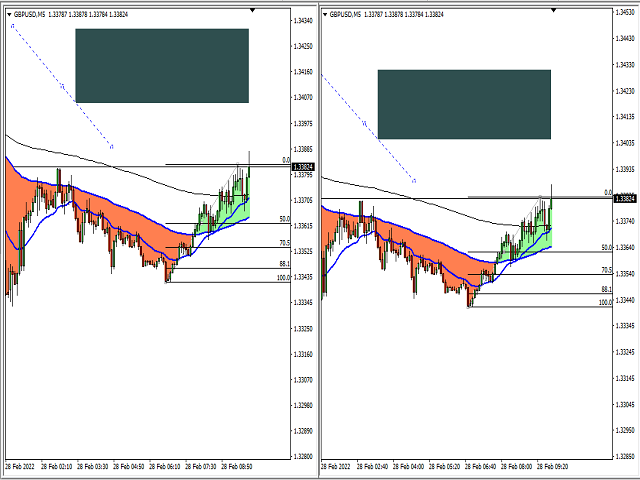
Synchronize objects from one chart to multiple charts.
Synchronize objects from one chart to multiple charts.
1. Allows automatic synchronization of new and edited objects to other charts.
2. Allows synchronization of all objects on the chart to other charts at the current time.
3. Allows setting the charts to synchronize based on the position of the chart in the MT4 window.
Version 1.2:
Allow set list of object names that you don't want to sync (Separated by commas ",")
Allow set 5 types of objects that you don't want to sync


Great Job !!!