• Panoramica
  • Recensioni (2)
  • Commenti (4)
  • Novità

Regressor

1

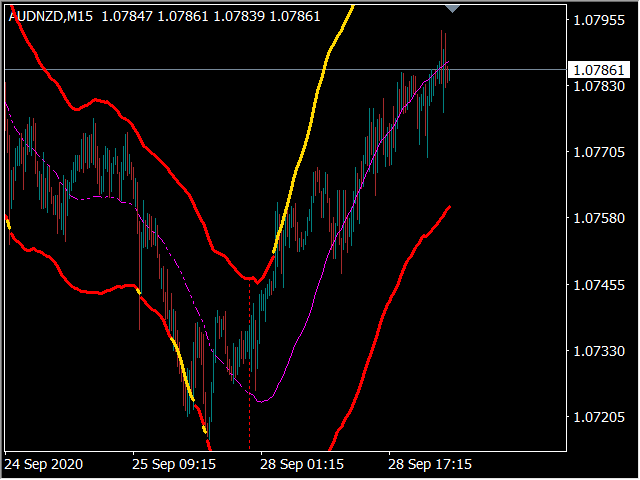
Canale dinamico. La larghezza del canale cambia automaticamente in base al movimento del prezzo. Più forte è la deviazione dal centro del canale, più ampi diventano i confini. L'indicatore si adatta ai movimenti sulla sezione del grafico specificata (parametro "Bars for calculations"). Di conseguenza, se il prezzo ha fatto una forte oscillazione a un determinato intervallo, il canale si espanderà, in attesa di ulteriori forti fluttuazioni. Cioè, i suoi parametri corrisponderanno sempre all'attuale situazione del mercato.

Il canale non è progettato per analizzare i dati storici! Per verificare lo stato di salute, eseguilo nel tester!

Il canale si espande e si restringe, a seconda dei movimenti precedenti. Questi movimenti dipendono dal parametro "Bars for calculations". Se si imposta "Bars for calculations" =200, il canale si adatterà ai movimenti delle Ultime 200 barre. I limiti superiore e inferiore del canale si avvicineranno o si allontaneranno, a seconda della più grande deviazione dei movimenti precedenti nel "periodo". Di conseguenza, più il prezzo si discostava in precedenza dalla linea mediana, più ampio sarà il canale e, con un movimento più calmo, il canale si restringe. Allo stesso tempo, l'essenza stessa del canale è rimasta la stessa: i confini fanno la media delle deviazioni dalla linea mediana (TSF), ma la velocità di media dipende dalla velocità di variazione del prezzo. Più velocemente il prezzo si avvicina al confine del canale, più velocemente si espande.
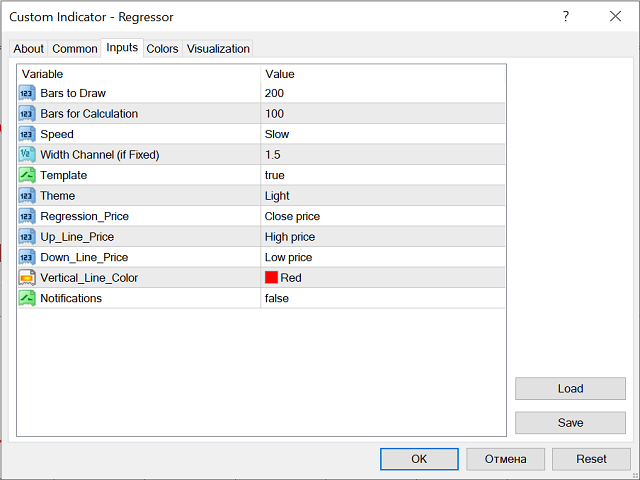
Parametri: 

"Bars to Draw" - il numero di barre della cronologia per visualizzare l'indicatore. È possibile ridurre il numero di barre per il rendering del canale in modo da non ingombrare la finestra del grafico. "Bars to Draw" deve essere maggiore di" Period " di 2 volte. Ciò contribuisce anche a ridurre il carico sulle risorse del processore.

"Bars for calculations" è il numero di barre per calcolare il canale. Questa opzione specifica la profondità per l'analisi dei dati storici. Il numero massimo di barre è 400. È questo segmento che determina la larghezza del canale. Per chiarezza, la linea centrale è tinta su di essa e l'inizio è segnato da una linea verticale. A contatto con il prezzo, anche i confini di questo sito sono colorati. Per testare il funzionamento dell'indicatore in tempo reale, eseguilo nel tester!

"Speed" - il parametro determina la velocità di variazione della larghezza del canale. Ci sono 4 opzioni:

  1. "Fisso" - i bordi del canale non si adattano al movimento, ma sono fissati a una determinata larghezza. La larghezza del canale può essere impostata utilizzando il parametro "Width Channel"
  2. "Lento" - lento. Se c'è stato un forte movimento in una determinata sezione del grafico, e poi immediatamente è iniziato calmo, i confini del canale dopo l'espansione si restringeranno lentamente. Lo stesso se è iniziato un movimento brusco, i confini si espanderanno lentamente.
  3. "Medium" - Media.
  4. "Veloce" - veloce.

"Width Channel (if Fixed) "- se L'opzione" Fixed " è attivata, è possibile impostare manualmente la larghezza del canale. Passaggio di modifica da 0.01

"Template" - la possibilità di abilitare o disabilitare il modello per il grafico.

"Tema" - scuro o leggero.

"Regression_Price", "Up_Line_Price", "Down_Line_Price" - il calcolo delle linee può essere modificato in base ai parametri: PRICE_CLOSE, PRICE_OPEN, PRICE_HIGH, PRICE_LOW, PRICE_MEDIAN, PRICE_TYPICAL, PRICE_WEIGHTED.

"Vertical_Line_Color" è il colore della linea che limita il numero di barre da calcolare. Può fare un clrnone incolore.

"Notifiche" - funzione per inviare messaggi al terminale mobile. Per fare ciò, inserisci il tuo ID terminale mobile, nelle Impostazioni "Notifiche" nel terminale con l'indicatore impostato.

La prima copia per$ 100, quindi il prezzo sarà aumentato.

    Prodotti consigliati
    Free automatic Fibonacci is an indicator that automatically plots a Fibonacci retracement based on the number of bars you select on the BarsToScan setting in the indicator. The Fibonacci is automatically updated in real time as new highest and lowest values appears amongst the selected bars. You can select which level values to be displayed in the indicator settings. You can also select the color of the levels thus enabling the trader to be able to attach the indicator several times with differe
    FREE
    TrendPlus
    Sivakumar Subbaiya
    4.08 (12)
    Trend Plus   Trendplus  Indicator   Time Frame: Suitable for any time frame.  Purpose: Trend Prediction. Blue and red candle indicate the buy and sell call respectively. Buy: When the blue candle is formed buy call is initiated. close the buy trades when the next red candle will formed.   Sell: When the Red candle is formed Sell call is initiated. close the Sell trades when the next blue candle will formed.   Happy trade!!
    FREE
    OrderBlock TS Roman
    Vladislav Vlastovskii
    3.8 (5)
    Индикатор строит блоки заказов (БЗ) по торговой системе (ТС) Романа. Поиск блоков осуществляется одновременно на двух таймфремах: текущем и старшем (определяемым в настройках). Для оптимизации и игнорирования устаревших блоков в настройках задается ограничение количества дней в пределах которых осуществляется поиск блоков. Блоки строятся по правилам ТС состоящем из трех шагов: какую свечу вынесли (что?); какой свечой вынесли (чем?); правило отрисовки (как?).
    FREE
    KeltnerChannelIndicator
    Todd Terence Bates
    5 (1)
    The Keltner Channel is a volatility-based technical indicator composed of three separate lines. The middle line is an exponential moving average (EMA) of the price. Additional lines are placed above and below the EMA. The upper band is typically set two times the Average True Range (ATR) above the EMA, and the lower band is typically set two times the ATR below the EMA. The bands expand and contract as volatility (measured by ATR) expands and contracts. Since most price action will be encompasse
    FREE
    Follow The Line
    Oliver Gideon Amofa Appiah
    4.07 (14)
    FOLLOW THE LINE GET THE FULL VERSION HERE: https://www.mql5.com/en/market/product/36024 This indicator obeys the popular maxim that: "THE TREND IS YOUR FRIEND" It paints a GREEN line for BUY and also paints a RED line for SELL.  It gives alarms and alerts of all kinds. IT DOES NOT REPAINT and can be used for all currency pairs and timeframes. Yes, as easy and simple as that. Even a newbie can use it to make great and reliable trades. NB: For best results, get my other premium indicators for more
    FREE
    Donchian channels are a tool in technical analysis used to determine the relative volatility of a market and the potential for price breakouts. Can help identify potential breakouts and reversals in price, which are the moments when traders are called on to make strategic decisions. These strategies can help you capitalize on price trends while having pre-defined entry and exit points to secure gains or limit losses. Using the Donchian channel can thus be part of a disciplined approach to manag
    FREE
    Wise Men Indicator demo
    Bohdan Kasyanenko
    3 (2)
    The indicator displays signals according to the strategy of Bill Williams on the chart. Demo version of the indicator has the same features as the paid, except that it can work only on a demo account . Signal "First Wise Man" is formed when there is a divergent bar with angulation.  Bullish divergent bar - with lower minimum and closing price in the upper half. Bearish divergent bar - higher maximum and the closing price at the bottom half. Angulation is formed when all three lines of Alligat
    FREE
    ZigZag Support Resistance MT4
    Emmanuel Tshepang Mosweu
    4 (1)
    This indicator uses the Zigzag indicator to identify swing highs and swing lows in the price chart.    Once it has identified the swing highs and swing lows, it can use them to determine potential support and resistance levels. A support level is formed when the price drops and bounces back up from a swing low, indicating that there is buying pressure at that level. A resistance level is formed when the price rises and reverses downward from a swing high, suggesting selling pressure at that leve
    FREE
    Wave Reversal Indicator - determina la direzione e le inversioni di prezzo attorno alla linea di equilibrio. L'indicatore mostra i movimenti delle onde e i picchi di tendenza. Dà consigli su dove seguire il trader, aiuta a seguire la strategia di trading. È un'aggiunta a una strategia intraday o a medio termine. Quasi tutti i parametri vengono selezionati per ciascun intervallo di tempo e cambiano automaticamente; l'unico parametro per la regolazione manuale è la lunghezza d'onda. Tempi ott
    The indicator uses the Chester W. Keltner's channel calculation method, modified by the well-known trader Linda Raschke. Due to the modification, the calculated channel contains a much more complete overview of the price movements, which allows increasing the probability of an accurate prediction of the upcoming price movement. Unlike the classic Keltner method, the base line of the channel is plotted based on the Exponential Moving Average, and the Average True Range is used to calculate the up
    FREE
    UPD1 X00 Levels
    Vitaliy Kuznetsov
    5 (8)
    L'indicatore mostra livelli circolari sul grafico. Sono anche chiamati livelli psicologici, bancari o dei principali operatori. A questi livelli si verifica una vera e propria lotta tra tori e orsi, l'accumulo di molti ordini, che porta a un aumento della volatilità. L'indicatore si adatta automaticamente a qualsiasi strumento e timeframe. Se il livello 80 viene rotto e poi testato, acquistare. Se il livello 20 viene rotto e poi testato, vendere. L'obiettivo è 00. Attenzione. A causa dei forti
    FREE
    Necessary for traders: tools and indicators Waves automatically calculate indicators, channel trend trading Perfect trend-wave automatic calculation channel calculation , MT4 Perfect trend-wave automatic calculation channel calculation , MT5 Local Trading copying Easy And Fast Copy , MT4 Easy And Fast Copy , MT5 Local Trading copying For DEMO Easy And Fast Copy , MT4 DEMO Easy And Fast Copy , MT5 DEMO The homeopathic indicator is also called the CCI indicator. The CCI indicator was propos
    FREE
    This is a regression tree indicator for MT4/MT5. This indicator classificate nodes on the time period so that the deviation becomes smaller, and displays regression line and channel for each node. It's free! Attached CartDemo.ex4 and CartDemo.ex5 is a Demo version and has the following limitations: Method is RandomForest only Maximum number of bars is 200 Maximum number of trees is 2 Maximum tree depth is 2 Calculated waste lines are shown Not display correlation coefficients Fu
    FREE
    Updates 9/12/2023 - If you are looking for the Spock EA, I don't sell it anymore. DM me for more info. 24/10/2023  -  Check out my other products. Starting to roll out some EAs & indicators based on this range. Currently there is no MT5 version. I am using MT4 myself. So I will spend my time mostly to develop more extensive stats for the Stats version and maybe even an EA. But I might  develop a MT5 version. All depends on the demand. Meaning, the more people request it, the bigger the
    FREE
    Peak Trough Analysis is the great tool to detect peaks and troughs in your chart. Peak Trough Analysis tool can use three different peaks and troughs detection algorithm. The three algorithm include the orignal Fractals Indicator by Bill Williams, the Modified Fractals indicator and ZigZag indicator. You can use this peak and trough analysis tool to detect the price pattern made up from Equilibrium Fractal-Wave process. For further usage, there are good guide line on how to use this peak trough
    FREE
    The Sextet
    Naim El Hajj
    4 (3)
    The Sextet  is an MT4 indicator that displays 6 levels of Moving Averages, where the second is the moving average of the first, the third of the second, and so on. It gives a signal when all the moving average levels align in order. Get a Free Sextet EA, and read discussions about using The Sextet Indicator on Forex Factory: The Sextet EA @ Forex Factory Check out the  The Sextet Scalper Pro  for a more elaborate scalping strategy also with  Free EA . Key Features: Is a Moving Average of a Movi
    FREE
    Defines extremes. This indicator consists of two parts. The first draws lines on the chart indicating low volatility in relative daily market activity. The second is responsible for determining the extremum and gives signals to buy or sell. This system is suitable for all instruments. It is recommended to use a timeframe from m15 to h4. Before using, you need to choose the settings for yourself. Configure lines deviation. Specify volatility coefficient. Advantages The indicator does not repaint
    FREE
    Le medie mobili cambiano in movimento. L'indicatore seleziona automaticamente il periodo per calcolare le medie mobili. Maggiore è il movimento direzionale, maggiore è il periodo di media. Quando la tendenza rallenta, il periodo delle medie mobili diminuisce e diventano più veloci. Ciò consente una risposta più rapida al cambiamento di tendenza.  L'indicatore funziona bene in una tendenza o in un punto di inversione di tendenza. In verde indicatore può essere usato al contrario, ad esempio qu
    FREE
    LyfUD指标专门 为黄金设计的趋势指标 ,也可以用于任何金融工具。用于及时反映多空力量,由U线和D线组成, 波动以0为中轴偏离运行, U线为快线D线为慢线。 LyfUD指标可以和 绝大多数策略结合使用 ,能够更加有效的把握风控。 U线和D线采用价格行为市场追踪算法,能及时反映市场方向, 可用在任意货币。 特性: 1. U线、D线在0轴上方,买入信号参考。 2. U线、D线 在0轴下方 ,卖出信号参考。 3. U线、D  线极限背离转向,行情可能出现反转。 4.  滞后性低,能及时反映趋势。 致力于结合其他指标,LyfUD和  均线、Pinbar  等搭配使用能迅速找到一些合理的关键位。 LyfUD只作为参考依据,其风险与作者无关。未经作者同意,禁止他售。
    FREE
    Are you tired of drawing trendlines every time you're analyzing charts? Or perhaps you would like more consistency in your technical analysis. Then this is for you. This indicator will draw trend lines automatically when dropped on a chart. How it works Works similar to standard deviation channel found on mt4 and mt5. It has 2 parameters: 1. Starting Bar 2. Number of bars for calculation The   starting bar   is the bar which drawing of the trend lines will begin, while the   number of bars for c
    FREE
    Extremum by trend
    Anton Iudakov
    5 (1)
    Looking for entry points along the local trend without repaint! Arrows indicate entry points. Based on classic indicators. The indicator is easy to use. Settings Наименование Описание Frequency factor Signal frequency. The less, the more often. This affects the quality. Recommendations Recommended for use on major currency pairs. Timeframe from m5, m15, m30 Subscribe to my telegram channel, where we discuss intraday trading, ideas, indicators, etc., a link in my profile contacts.
    FREE
    Extremum Reverse Bar
    Yurij Izyumov
    2.8 (5)
    This indicator has been created for finding the probable reversal points of the symbol price. A small candlestick reversal pattern is used it its operation in conjunction with a filter of extremums. The indicator is not redrawn! If the extremum filter is disabled, the indicator shows all points that have a pattern. If the extremum filter is enabled, the condition works – if the history Previous bars 1 candles back contains higher candles and they are farther than the Previous bars 2 candle, such
    FREE
    RSI Candle Signal
    Jonathan Destailleur
    4.5 (2)
    RSI Candle Signal Indicator will change bars’ color when set overbought or oversold levels reach. How to Use RSI Candle Signal Uptrend/Downtrends  - RSI may be used to detect trending markets. For example, the RSI may stay above the mid line 50 in an uptrend. Top and Buttoms  - RSI may help in identifying the tops around the overbought readings (usually above 70), and the bottoms around the oversold area (usually below 30). Divergence  - divergence occurs when RSI directional movement is not c
    FREE
    Trend arrow Indicator
    NGUYEN NGHIEM DUY
    3.33 (9)
    Trend arrow Indicator is an arrow Indicator used as an assistant tool for your trading strategy. The indicator analyzes the standard deviation of bar close for a given period and generates a buy or sell signals if the deviation increases. It good to combo with Martingale EA to follow Trend and Sellect Buy Only/Sell Only for EA work Semi-Automatic. You can use this  Indicator with any EAs in my Products.
    FREE
    VR Donchian
    Vladimir Pastushak
    4.85 (13)
    L'indicatore VR Donchian è una versione migliorata del canale Donchian. I miglioramenti hanno interessato quasi tutte le funzioni del canale, ma l'algoritmo operativo principale e la costruzione del canale sono stati preservati. All'indicatore a sfera è stato aggiunto un cambiamento nel colore dei livelli a seconda della tendenza attuale: questo mostra chiaramente al trader un cambiamento di tendenza o un livello piatto. È stata aggiunta la possibilità di informare il trader del superamento di u
    FREE
    Stable Trend MA
    Yurij Izyumov
    5 (1)
    The indicator is based on a single Moving Average of a user-defined period. By analyzing the price movement of the price relative to this MA, and also by tracking all updates of the price Highs and Lows over the same period as the MA period, the indicator draws its own picture of the trend, avoiding the ever-breaking MA lines. Therefore, if the trend goes up, the line will also point upwards and will not change its direction even on small retracements, allowing to capture almost the entire trend
    FREE
    With this system you can spot high-probability trades in direction of strong trends. You can profit from stop hunt moves initiated by the smart money! Important Information How you can maximize the potential of the scanner, please read here: www.mql5.com/en/blogs/post/718109 Please read also the blog about the usage of the indicator: Professional Trading With Strong Momentum This FREE Version of the indicator works only on EURUSD and GBPUSD. The full version of the indicator can be found here:
    FREE
    RSI With Alert Relative strength index (RSI) indicator is a popular technical indicator in the family of oscillators. RSI oscillates between 0 and 100 and traders use it to spot overbought and oversold states in the market. Typically, a value above 70 means that the instrument is overbought and due to a retracement. A value below 30 means that the trading instrument is oversold. RSI indicator strategies This indicator allows you to get notifications when some conditions trigger. You c
    FREE
    Traditional MACD MT4
    Daniel Lewis
    4.59 (56)
    MACD indicator in MetaTrader 4/5 looks different than MACD does in most other charting software. That is because the MetaTrader 4/5 version of MACD displays the MACD line as a histogram when it is traditionally displayed as a line. Additionally, the MetaTrader 4/5 version computes the Signal line using an SMA, while according to MACD definition it is supposed to be an EMA. The MetaTrader 4/5 version also does not compute a true MACD Histogram (the difference between the MACD/Signal lines). This
    FREE
    MTF Stochastic and RSI
    Georgiy Gazaryan
    5 (2)
    A simple but effective helper that will allow you to track both global and local market trends. The indicator combines the work of two oscillators: Stochastic and RSI. Both indicators can be set to any timeframe. Advantages of Use Multitimeframe - you can adjust both indicators to the desired timeframes. To obtain the entry points, you can use the Elder's triple screen system. Highly customizable - you can configure not only the parameters of the indicators, but also their appearance (color an
    FREE
    Gli utenti di questo prodotto hanno anche acquistato
    Gann Made Easy
    Oleg Rodin
    4.86 (83)
    Gann Made Easy è un sistema di trading Forex professionale e facile da usare che si basa sui migliori principi del trading utilizzando la teoria di mr. WD Gann. L'indicatore fornisce segnali ACQUISTA e VENDI accurati, inclusi i livelli di Stop Loss e Take Profit. Puoi fare trading anche in movimento utilizzando le notifiche PUSH. Vi prego di contattarmi dopo l'acquisto! Condividerò i miei consigli di trading con te e fantastici indicatori bonus gratuitamente! Probabilmente hai già sentito parlar
    - Real price is 80$ - 40% Discount ( It is 49$ now ) Contact me for instruction, add group and any questions! Related Products:  Bitcoin Expert , Gold Expert Introduction The breakout and retest strategy is traded support and resistance levels. it involves price breaking through a previous level.  The break and retest strategy is designed to help traders do two main things, the first is to avoid false breakouts. Many false breakouts start with a candlestick that breaks out of a level but ends w
    FX Volume
    Daniel Stein
    4.58 (33)
    Ricevi il tuo aggiornamento quotidiano sul mercato con dettagli e schermate tramite il nostro Morning Briefing qui su mql5 e su Telegram ! FX Volume è il PRIMO e UNICO indicatore di volume che fornisce una visione REALE del sentiment del mercato dal punto di vista del broker. Fornisce informazioni straordinarie su come gli operatori di mercato istituzionali, come i broker, sono posizionati sul mercato Forex, molto più velocemente dei rapporti COT. Vedere queste informazioni direttamente sul vo
    Enigmera
    Ivan Stefanov
    5 (3)
    ENIGMERA: Il cuore del mercato https://www.enigmera.com Introduzione Questo indicatore e sistema di trading rappresenta un approccio straordinario ai mercati finanziari. ENIGMERA utilizza i cicli frattali per calcolare con precisione i livelli di supporto e resistenza. Mostra l'autentica fase di accumulazione e fornisce direzione e obiettivi.  Un sistema che funziona sia in un trend che in una correzione.  Come funziona? ENIGMERA è composto da tre linee: la linea di supporto/resistenza, la
    Gold Stuff
    Vasiliy Strukov
    4.89 (241)
    Gold Stuff è un indicatore di tendenza progettato specificamente per l'oro e può essere utilizzato anche su qualsiasi strumento finanziario. L'indicatore non ridisegna e non è in ritardo. Periodo consigliato H1. Su di esso l'indicatore funziona in modo completamente automatico Expert Advisor EA Gold Stuff. Lo trovi nel mio profilo. I risultati in tempo reale possono essere visualizzati qui.  Puoi ottenere una copia gratuita del nostro indicatore Strong Support e Trend Scanner, per favore scri
    Atomic Analyst
    Issam Kassas
    5 (2)
    Innanzitutto, vale la pena sottolineare che questo indicatore di trading non è repaint, non è ridisegno e non presenta ritardi, il che lo rende ideale sia per il trading manuale che per quello automatico. Manuale utente: impostazioni, input e strategia. L'Analista Atomico è un indicatore di azione del prezzo PA che utilizza la forza e il momentum del prezzo per trovare un miglior vantaggio sul mercato. Dotato di filtri avanzati che aiutano a rimuovere rumori e segnali falsi, e aumentare il pote
    FX Power MT4 NG
    Daniel Stein
    5 (13)
    Ricevi il tuo aggiornamento quotidiano sul mercato con dettagli e schermate tramite il nostro Morning Briefing qui su mql5 e su Telegram ! FX Power MT4 NG è la nuova generazione del nostro popolare misuratore di forza delle valute, FX Power. Cosa offre questo misuratore di forza di nuova generazione? Tutto ciò che avete amato dell'FX Power originale IN PIÙ Analisi della forza di ORO/XAU Risultati di calcolo ancora più precisi Periodi di analisi configurabili individualmente Limite di calcolo pe
    Trend Punch
    Mohamed Hassan
    4.95 (19)
    This indicator is unstoppable when combined with our other indicator called  Support & Resistance . After purchase, send us a message and you will get it   for  FREE as a BONUS! Introducing Trend Punch , the revolutionary forex trend indicator that will transform the way you trade! Trend Punch is uniquely designed to provide precise buy and sell arrows during strong market trends, making your trading decisions clearer and more confident. Whether you're trading major currency pairs or exotic sym
    Gann Swing Structure
    Kirill Borovskii
    5 (1)
    This indicator is based on the mathematics of the great trader W.D. Ganna. With its help, you can easily find strong levels by analyzing swings to find the optimal entry point. The indicator works on all instruments and all timeframes. The indicator is fully manual and has control buttons. All you need to do is press the NEW button, a segment will appear, which you can place on any movement, swing or even 1 candle that you want to analyze. By placing the segment, press the OK button. A grid (th
    Scalper Inside PRO
    Alexey Minkov
    4.73 (56)
    An exclusive indicator that utilizes an innovative algorithm to swiftly and accurately determine the market trend. The indicator automatically calculates opening, closing, and profit levels, providing detailed trading statistics. With these features, you can choose the most appropriate trading instrument for the current market conditions. Additionally, you can easily integrate your own arrow indicators into Scalper Inside Pro to quickly evaluate their statistics and profitability. Scalper Inside
    Dynamic Forex28 Navigator
    Bernhard Schweigert
    5 (1)
    Dynamic Forex28 Navigator - Lo strumento di trading Forex di nuova generazione. ATTUALMENTE SCONTATO DEL 49%. Dynamic Forex28 Navigator è l'evoluzione dei nostri indicatori popolari di lunga data, che combinano la potenza di tre in uno: Advanced Currency Strength28 Indicator (695 recensioni) + Advanced Currency IMPULSE con ALERT (520 recensioni) + CS28 Combo Signals (Bonus). Dettagli sull'indicatore https://www.mql5.com/en/blogs/post/758844 Cosa offre l'indicatore di forza di nuova generazion
    Attualmente 20% di sconto! La soluzione migliore per ogni principiante o trader esperto! Questo software per cruscotti funziona su 28 coppie di valute. Si basa su 2 dei nostri indicatori principali (Advanced Currency Strength 28 e Advanced Currency Impulse). Offre un'ottima panoramica dell'intero mercato Forex. Mostra i valori di forza delle valute avanzate, la velocità di movimento delle valute e i segnali per 28 coppie Forex in tutti i (9) timeframe. Immaginate come migliorerà il vostro t
    Trend Screener
    STE S.S.COMPANY
    4.81 (88)
    Indicatore di tendenza, soluzione unica rivoluzionaria per il trading di tendenze e il filtraggio con tutte le importanti funzionalità di tendenza integrate in un unico strumento! È un indicatore multi-timeframe e multi-valuta al 100% non ridipingibile che può essere utilizzato su tutti i simboli/strumenti: forex, materie prime, criptovalute, indici e azioni. OFFERTA A TEMPO LIMITATO: l'indicatore di screening di supporto e resistenza è disponibile a soli 50$ e a vita. (Prezzo originale 250$) (o
    TPSproTREND PrO
    Roman Podpora
    4.79 (19)
    TPSpro TREND PRO   è un indicatore di tendenza che analizza automaticamente il mercato, fornisce informazioni sulla tendenza e sui rispettivi cambiamenti e fornisce segnali per entrare nelle operazioni senza ridisegnare. L'indicatore utilizza ciascuna candela e la analizza separatamente. Si riferisce a vari shock al rialzo o al ribasso. Punto di ingresso preciso per il trading di valute, criptovalute, metalli, azioni e indici! Versione MT5                   Descrizione completa dell'indicatore
    Vi presentiamo ON Trade Waves Patterns Harmonic Elliot Wolfe, un indicatore avanzato progettato per rilevare vari tipi di pattern sul mercato utilizzando metodi sia manuali che automatici. Ecco come funziona: Pattern Armonici: Questo indicatore è in grado di individuare pattern armonici che appaiono sul vostro grafico. Questi pattern sono fondamentali per i trader che praticano la teoria del trading armonico, come descritta nel libro di Scott Carney "Harmonic Trading vol 1 & 2". Che li disegniat
    Scalper Vault
    Oleg Rodin
    5 (27)
    Scalper Vault è un sistema di scalping professionale che ti fornisce tutto il necessario per scalping di successo. Questo indicatore è un sistema di trading completo che può essere utilizzato dai trader di forex e opzioni binarie. L'intervallo di tempo consigliato è M5. Il sistema fornisce segnali di freccia accurati nella direzione della tendenza. Ti fornisce anche i segnali più alti e più bassi e i livelli di mercato di Gann. Gli indicatori forniscono tutti i tipi di avvisi, comprese le notifi
    TPA True Price Action indicator reveals the true price action of the market makers through 100% non-repainting signals (except early signals mode) strictly at the close of a candle! TPA shows entries and re-entries, every time the bulls are definitely stronger than the bears and vice versa. Not to confuse with red/green candles. The shift of power gets confirmed at the earliest stage and is ONE exit strategy of several. There are available now two free parts of the TPA User Guide for our custo
    Stratos Pali
    Michela Russo
    5 (1)
    Stratos Pali Indicator   is a revolutionary tool designed to enhance your trading strategy by accurately identifying market trends. This sophisticated indicator uses a unique algorithm to generate a complete histogram, which records when the trend is Long or Short. When a trend reversal occurs, an arrow appears, indicating the new direction of the trend. Important Information Revealed Leave a review and contact me via mql5 message to receive My Top 5 set files for Stratos Pali at no cost! D
    Currency Strength Wizard è un indicatore molto potente che ti fornisce una soluzione all-in-one per un trading di successo. L'indicatore calcola la potenza di questa o quella coppia forex utilizzando i dati di tutte le valute su più intervalli di tempo. Questi dati sono rappresentati in una forma di indice di valuta facile da usare e linee elettriche di valuta che puoi utilizzare per vedere il potere di questa o quella valuta. Tutto ciò di cui hai bisogno è collegare l'indicatore al grafico che
    PRO Renko System
    Oleg Rodin
    5 (25)
    PRO Renko System è un sistema di trading altamente accurato appositamente progettato per il trading di grafici RENKO. Questo è un sistema universale che può essere applicato a vari strumenti di trading. Il sistema neutralizza efficacemente il cosiddetto rumore di mercato che consente di accedere a segnali di inversione accurati. L'indicatore è molto facile da usare e ha un solo parametro responsabile della generazione del segnale. Puoi facilmente adattare lo strumento a qualsiasi strumento
    Black dragon indicator
    Ramil Minniakhmetov
    4.86 (111)
    L'indicatore di rilevamento delle tendenze integrerà qualsiasi strategia e può anche essere utilizzato come strumento indipendente. IMPORTANTE! Contattami subito dopo l'acquisto per ricevere istruzioni e un bonus! Raccomandazioni per lavorare con l'indicatore, puoi scaricare nel commento n Vantaggi Facile da usare, non sovraccarica il grafico con informazioni non necessarie; Possibilità di utilizzo come filtro per qualsiasi strategia; Ha livelli integrati di supporto e resistenza dinami
    TPSpro RFI Levels
    Roman Podpora
    4.82 (22)
    ISTRUZIONI       RUS   -   INGLESE       Si   consiglia di utilizzare con un indicatore       -       TPSpro   TENDENZA PRO -   Versione MT4         Un elemento chiave nel trading sono le zone o i livelli da cui vengono prese le decisioni di acquisto o vendita di uno strumento di trading. Nonostante i tentativi dei principali attori di nascondere la loro presenza sul mercato, lasciano inevitabilmente delle tracce. Il nostro compito era imparare a identificare queste tracce e interpretarle corre
    Currency Strength Exotics
    Bernhard Schweigert
    4.87 (30)
    ATTUALMENTE SCONTATO DEL 20%! La soluzione migliore per qualsiasi principiante o trader esperto! Questo indicatore è specializzato nel mostrare la forza della valuta per qualsiasi simbolo come coppie esotiche, materie prime, indici o futures. È il primo nel suo genere, qualsiasi simbolo può essere aggiunto alla nona riga per mostrare la vera forza della valuta di Oro, Argento, Petrolio, DAX, US30, MXN, TRY, CNH ecc. Si tratta di uno strumento di trading unico, di alta qualità e conveniente
    Trend Pulse
    Mohamed Hassan
    5 (4)
    Please contact me after purchase to immediately get your PDF strategy + documentation for Trend Pulse !  Introducing Trend Pulse , a unique and robust indicator capable of detecting bullish, bearish, and even ranging trends! Trend Pulse uses a special algorithm to filter out market noise with real precision. If the current symbol is moving sideways, Trend Pulse will send you a ranging signal, letting you know that it's not a good time to enter a trade. This excellent system makes Trend Pulse
    Innanzitutto, vale la pena sottolineare che questo Strumento di Trading è un Indicatore Non-Ridipingente, Non-Ridisegnante e Non-Laggante, il che lo rende ideale per il trading professionale. Corso online, manuale utente e demo. L'Indicatore Smart Price Action Concepts è uno strumento molto potente sia per i nuovi che per i trader esperti. Racchiude più di 20 utili indicatori in uno solo, combinando idee di trading avanzate come l'Analisi del Trader del Circolo Interno e le Strategie di Trading
    MetaBands M4
    Vahidreza Heidar Gholami
    5 (2)
    MetaBands uses powerful and unique algorithms to draw channels and detect trends so that it can provide traders with potential points for entering and exiting trades. It’s a channel indicator plus a powerful trend indicator. It includes different types of channels which can be merged to create new channels simply by using the input parameters. MetaBands uses all types of alerts to notify users about market events. Features Supports most of the channel algorithms Powerful trend detection algorith
    ICT, SMC, SMART MONEY CONCEPTS, SMART MONEY, Smart Money Concept, Support and Resistance, Trend Analysis, Price Action, Market Structure, Order Blocks, BOS/CHoCH,   Breaker Blocks ,  Momentum Shift,   Supply&Demand Zone/Order Blocks , Strong Imbalance, HH/LL/HL/LH,    Fair Value Gap, FVG,  Premium  &   Discount   Zones, Fibonacci Retracement, OTE, Buy Side Liquidity, Sell Side Liquidity, BSL/SSL Taken, Equal Highs & Lows, MTF Dashboard, Multiple Time Frame, BigBar, HTF OB, HTF Market Structure, 
    Gold Channel is a volatility-based indicator, developed with a specific timing algorithm for the XAUUSD pair, which consists of finding possible corrections in the market. This indicator shows two outer lines, an inner line (retracement line) and an arrow sign, where the theory of the channel is to help identify overbought and oversold conditions in the market. The market price will generally fall between the boundaries of the channel. If prices touch or move outside the channel it is a tra
    Market Reversal Alerts
    LEE SAMSON
    4.19 (113)
    Il profitto dalla struttura del mercato cambia quando il prezzo si inverte e si ritira. L'indicatore di avviso di inversione della struttura del mercato identifica quando una tendenza o un movimento di prezzo si sta avvicinando all'esaurimento e pronto a invertire. Ti avvisa dei cambiamenti nella struttura del mercato che in genere si verificano quando stanno per verificarsi un'inversione o un forte pullback. L'indicatore identifica inizialmente i breakout e lo slancio del prezzo, ogni volta
    Automated Trendlines
    Georgios Kalomoiropoulos
    5 (16)
    Le linee di tendenza sono lo strumento più essenziale di analisi tecnica nel forex trading. Sfortunatamente, la maggior parte dei trader non li disegna correttamente. L'indicatore automatizzato delle linee di tendenza è uno strumento professionale per i trader seri che ti aiuta a visualizzare il movimento di tendenza dei mercati. Esistono due tipi di linee di tendenza, linee di tendenza rialziste e linee di tendenza ribassiste. Nella tendenza rialzista, la linea di tendenza Forex viene t
    Altri dall’autore
    Le medie mobili cambiano in movimento. L'indicatore seleziona automaticamente il periodo per calcolare le medie mobili. Maggiore è il movimento direzionale, maggiore è il periodo di media. Quando la tendenza rallenta, il periodo delle medie mobili diminuisce e diventano più veloci. Ciò consente una risposta più rapida al cambiamento di tendenza.  L'indicatore funziona bene in una tendenza o in un punto di inversione di tendenza. In verde indicatore può essere usato al contrario, ad esempio qu
    FREE
    Standard Scroller
    Aleksandr Kononov
    L'utilità controlla qualsiasi parametro di qualsiasi indicatore scorrendo la rotellina del mouse. È possibile installare questa utility e modificare l'interfaccia di qualsiasi indicatore dalla fornitura standard del terminale . Per gli indicatori personalizzati, così come quelli acquistati su "Market", c'è L'utilità Universal Scroller . Principio di funzionamento L'utilità controlla una delle opzioni selezionate modificandola scorrendo la rotellina del mouse. L'attivazione della modalità di s
    FREE
    Button CCI
    Aleksandr Kononov
    Finalmente l'interfaccia è diventata comoda. Ora puoi controllare il periodo dell'indicatore con il mouse. Basta fare clic sul pulsante e scorrere la rotellina del mouse per aumentare o diminuire il periodo CCI. Il pulsante può essere posizionato in qualsiasi posizione conveniente, fissato e utilizzato con un solo tocco. Su un grafico è possibile impostare diversi indicatori e gestirli singolarmente e tutti in una volta. La semplice installazione sul grafico consente di non preoccuparsi di rino
    FREE
    Button MA
    Aleksandr Kononov
    5 (1)
    Pulsante per controllare L'indicatore Media Mobile, consente di modificare facilmente il periodo dell'indicatore direttamente sul grafico utilizzando la rotellina del mouse. Non è necessario passare molte volte dallo schermo al grafico alle impostazioni dell'indicatore. Ora puoi controllare il periodo dell'indicatore con il mouse. Basta fare clic sul pulsante e scorrere la rotellina del mouse per aumentare o diminuire il periodo di media mobile. Il pulsante può essere posizionato in qualsiasi p
    Universal Scroller
    Aleksandr Kononov
    L'utilità controlla qualsiasi parametro di qualsiasi indicatore, scorrendo la rotellina del mouse. Se hai acquistato o noleggiato un indicatore, puoi modificarne l'interfaccia utilizzando questa utility. Qualsiasi indicatore che abbia almeno un parametro intero è adatto a questo.  Se vuoi prima provare come funziona, scarica l'indicatore Standart Scroller gratuito per controllare gli indicatori dalla fornitura standard del terminale.  Principio di funzionamento L'utilità controlla una delle
    Filtro:
    Viktor Kononov
    118
    Viktor Kononov 2022.03.13 16:32 
     

    L'utente non ha lasciato alcun commento sulla valutazione.

    julian karpet
    184
    julian karpet 2022.03.01 22:37 
     

    Is not this a duplicate indicator? Create new ideas. Thankful

    Aleksandr Kononov
    2687
    Risposta dello sviluppatore Aleksandr Kononov 2022.03.01 22:43
    No, there is a slightly different way of calculating. The borders are smoother and automatic adjustment to the price movement is added.
    Rispondi alla recensione
    Versione 1.82 2022.04.06
    Aggiunta la funzione di invio dei messaggi. Risolti piccoli bug
    Versione 1.81 2022.04.05
    Мелкие баги
    Versione 1.80 2022.04.05
    Aggiunto il disegno a colori per visualizzare l'area di calcolo dell'indicatore (periodo), colorare i bordi del canale quando si tocca il prezzo.
    Versione 1.70 2022.04.01
    Prezzi aggiunti per altri modi per calcolare i limiti e la linea mediana. Disegna il limite del periodo di calcolo. Possibilità di modificare la velocità di movimento dei confini. Possibilità di non utilizzare il calcolo dinamico, ma di impostare manualmente la larghezza del canale
    Versione 1.60 2022.04.01
    Added light and dark theme
    Versione 1.50 2022.03.30
    Modello aggiunto
    Versione 1.40 2022.03.30
    Se impostato su un programma o un cambiamento nel periodo di tempo, l'indicatore ricalcola immediatamente i movimenti precedenti (ora non c'è bisogno di aspettare)
    Versione 1.20 2022.03.30
    Fixed a bug, now the channel is not only expanding, but also narrowing.
    Versione 1.10 2022.03.04
    Изменение алгоритма расчета