Boom and Crash Spike Detector Indicator for MT5
- Indicatori
- STE S.S.COMPANY
- Versione: 1.0
- Attivazioni: 10
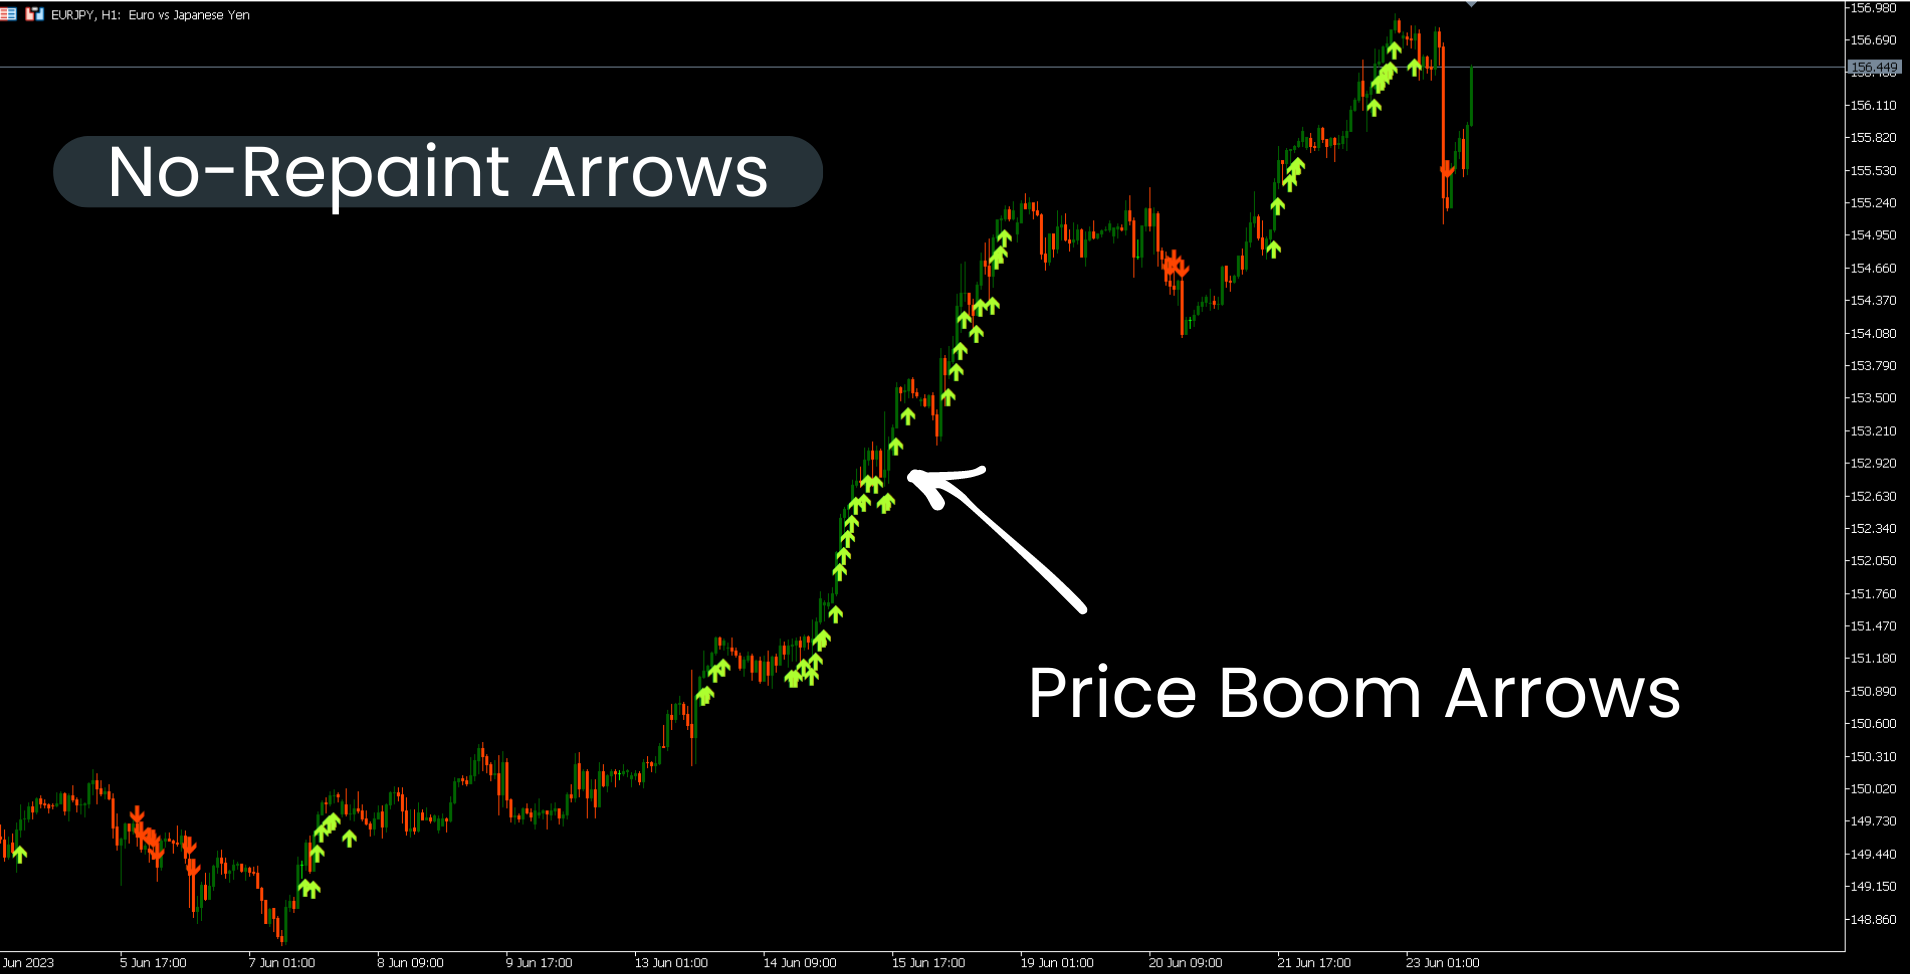
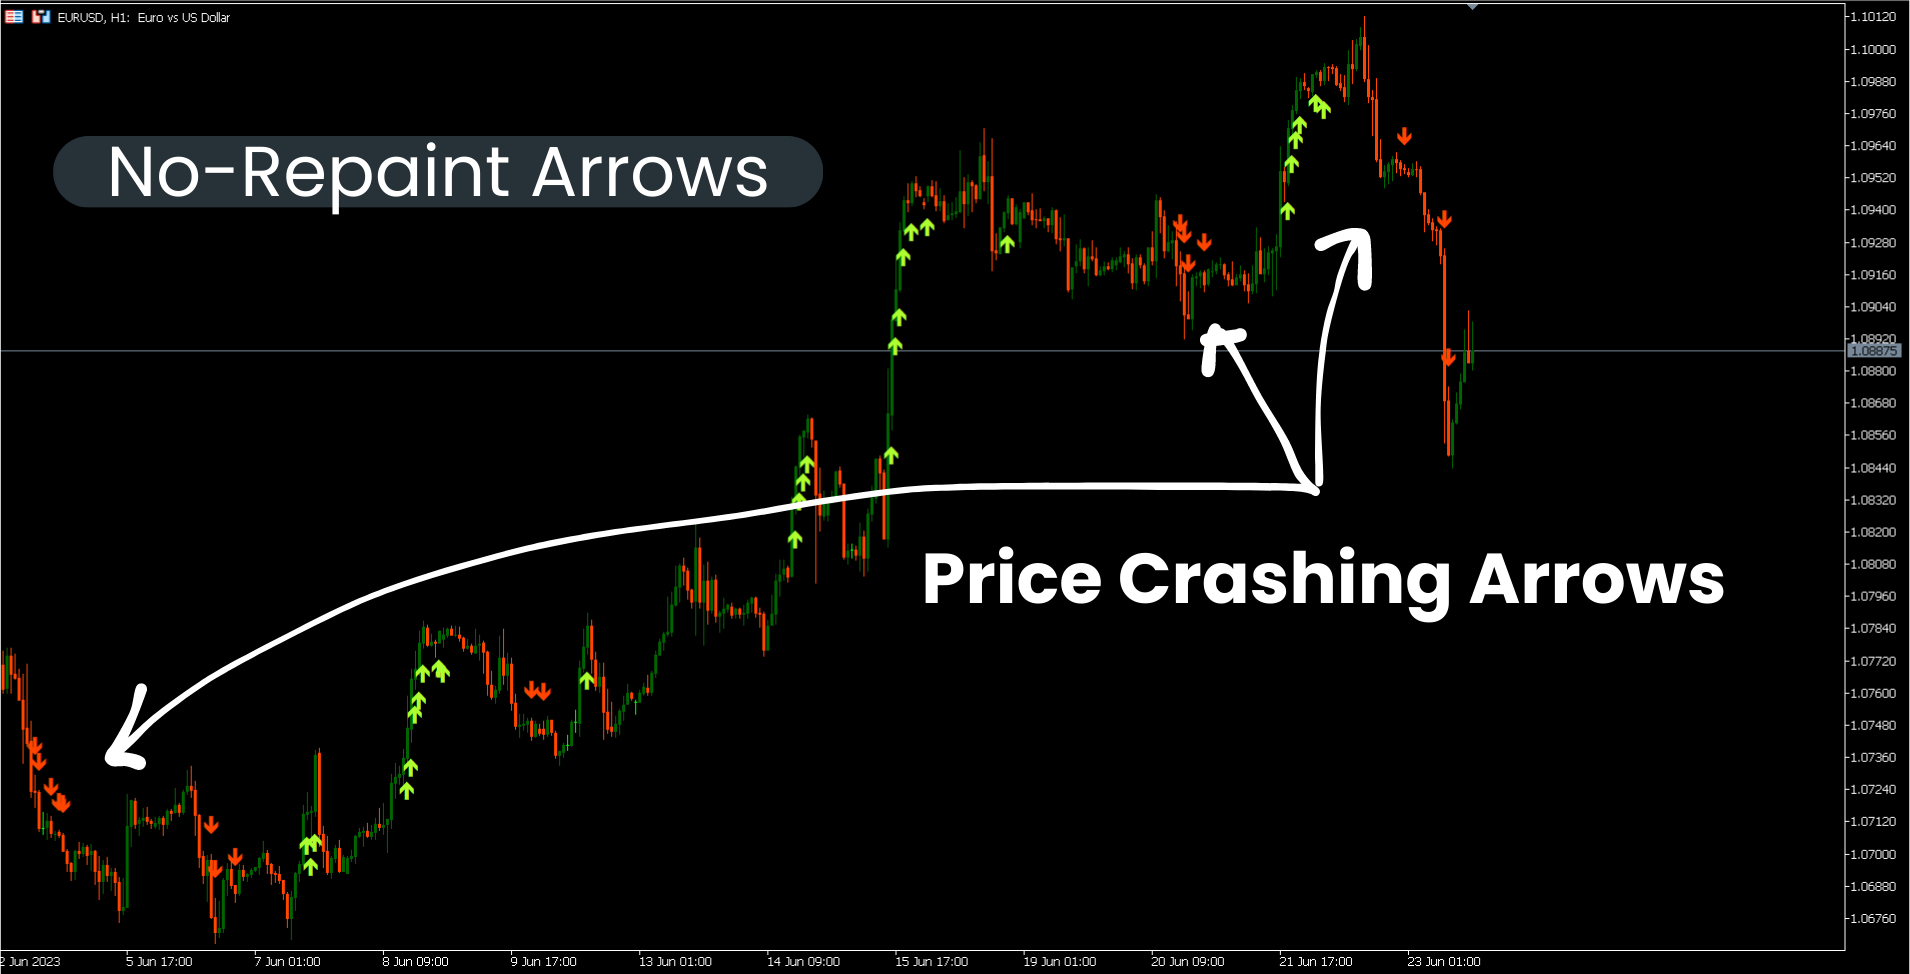
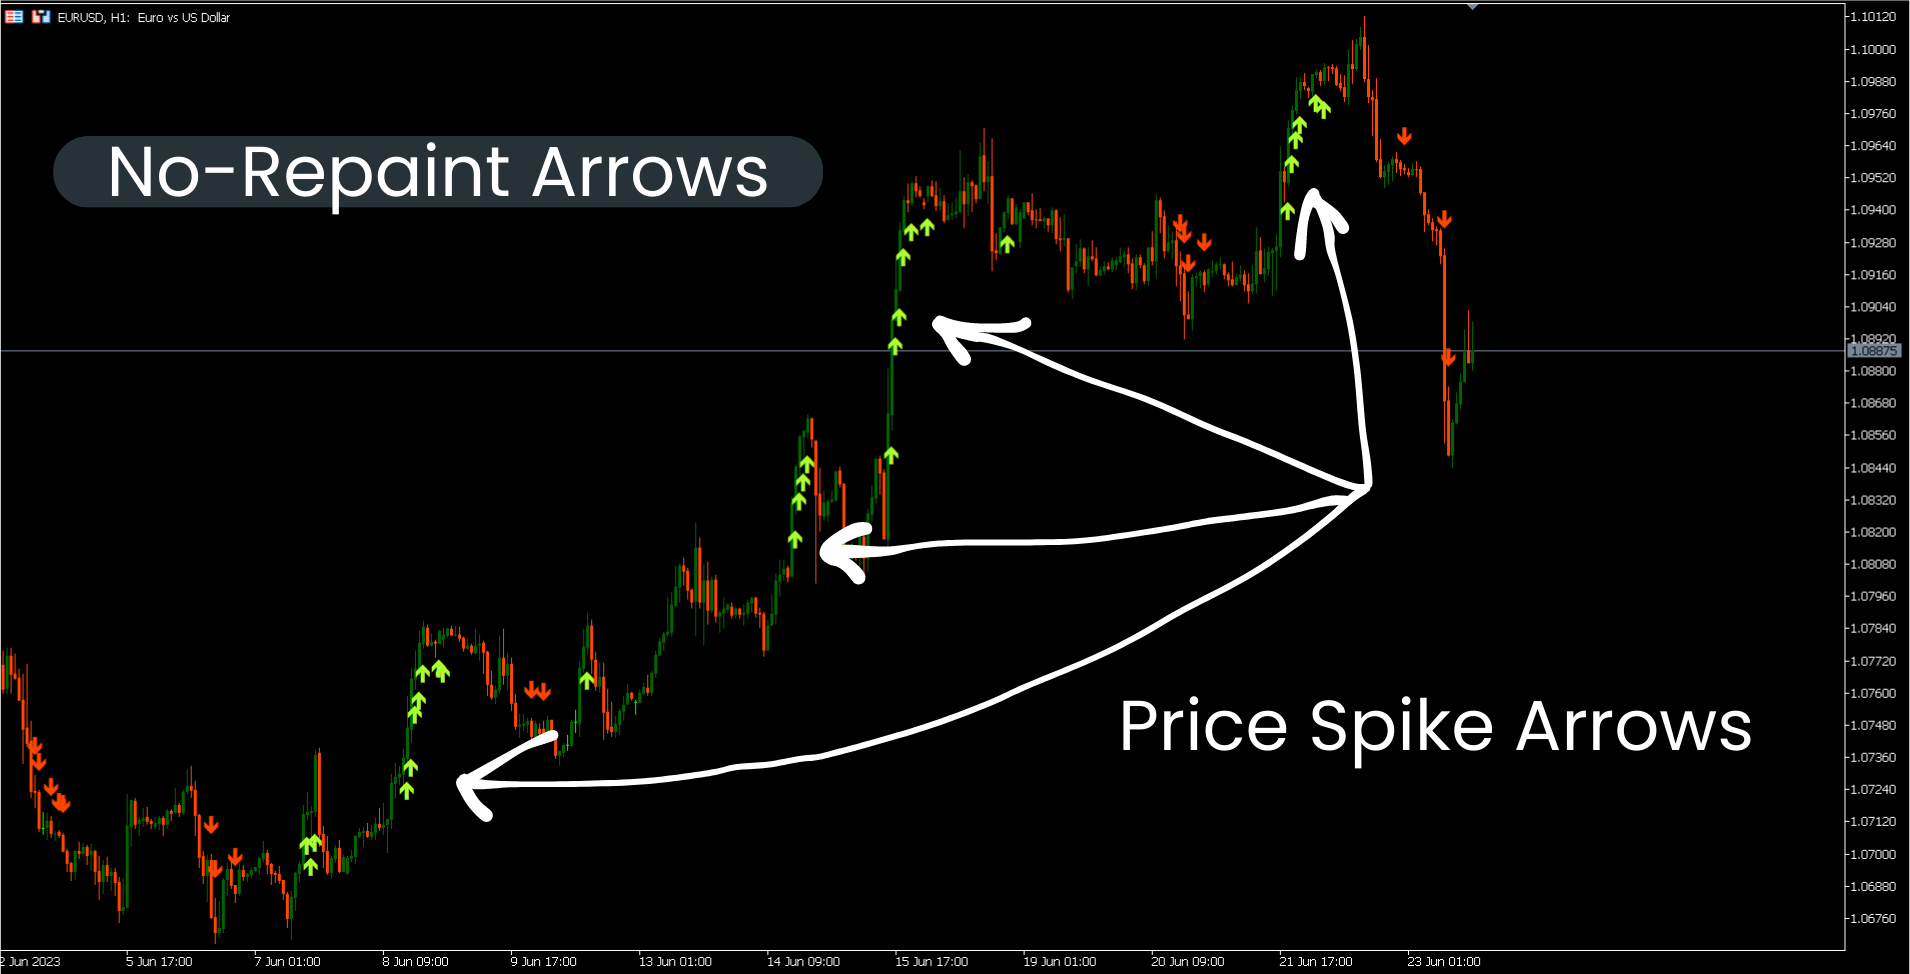
L'indicatore Boom and Crash Spike Detector è codificato in base a una strategia avanzata principalmente per rilevare il boom e il crash nei prezzi. Algoritmi complessi sono stati impiantati per rilevare boom e crash ad alta probabilità nei prezzi. Avvisa su potenziali fasi di boom o arresto anomalo:
- Fase boom: quando il prezzo aumenta troppo velocemente.
- Crash Phase: quando il prezzo diminuisce troppo velocemente.
OFFERTA A TEMPO LIMITATO: L'indicatore è disponibile per soli 30$ e per tutta la vita.
Caratteristiche principali
- Invia notifiche push al telefono cellulare
- Pop-up e avvisi sonori su computer o laptop
- Visualizza le frecce non ridipinte (frecce su per Potential Boom e frecce giù per Potential Crash)
- Lavorare con tutte le coppie.
Raccomandazione
- Tempi: H1 e H4
- Consiglia coppie: coppie in fasi di tendenza.
Contatto
Se hai qualche domanda o se hai bisogno di aiuto, contattami tramite messaggio privato.
Autore
SAYADI ACHREF, ingegnere del software fintech e fondatore di Finansya.
P0werful indicat0r, f0r b00m and crash H1 H4 Thumb up!