KT Bollinger Shots MT4
- Indicatori
- KEENBASE SOFTWARE SOLUTIONS
- Versione: 1.5
- Aggiornato: 24 gennaio 2023
- Attivazioni: 5
In addition, a mathematical algorithm is used with variable deviation to fine-tune the indicator's signals on a different level.
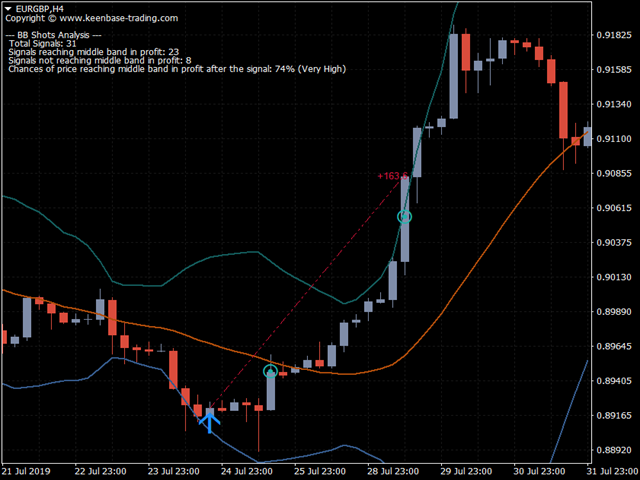
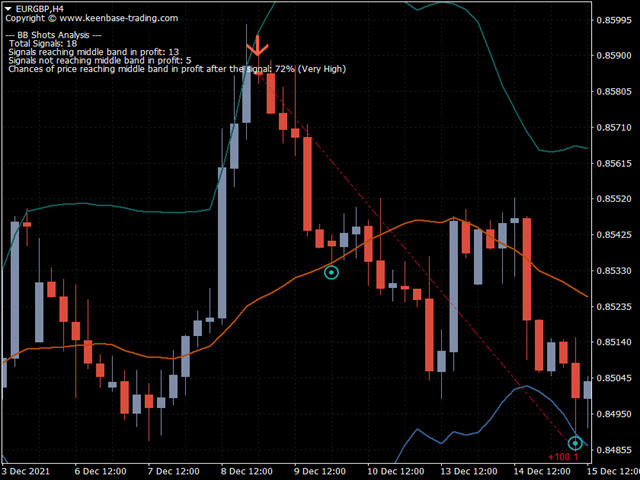
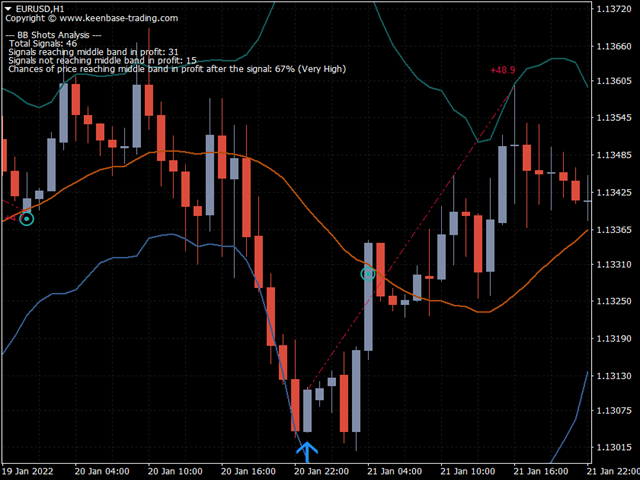
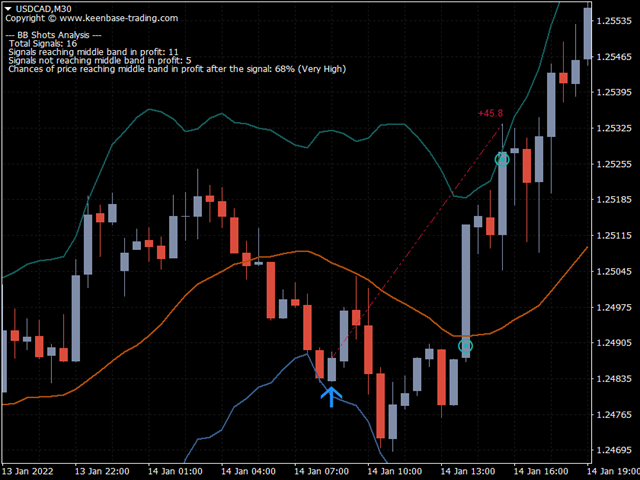
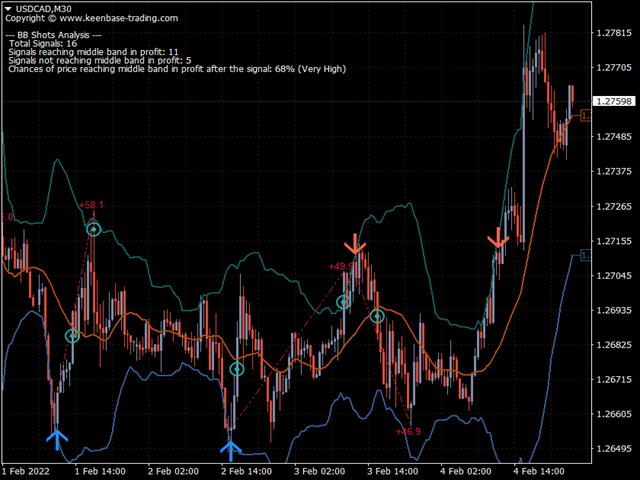
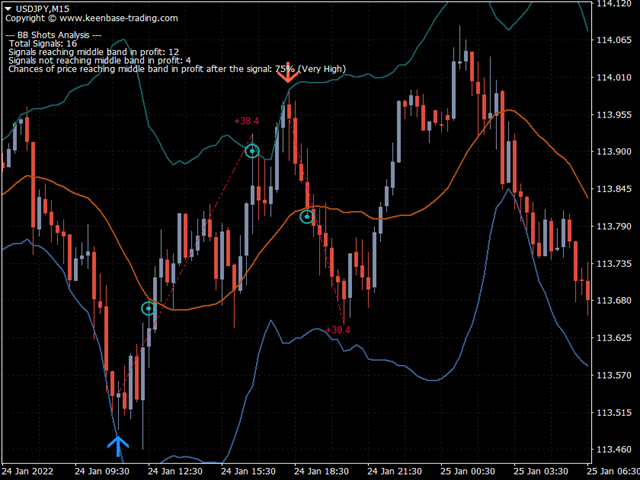
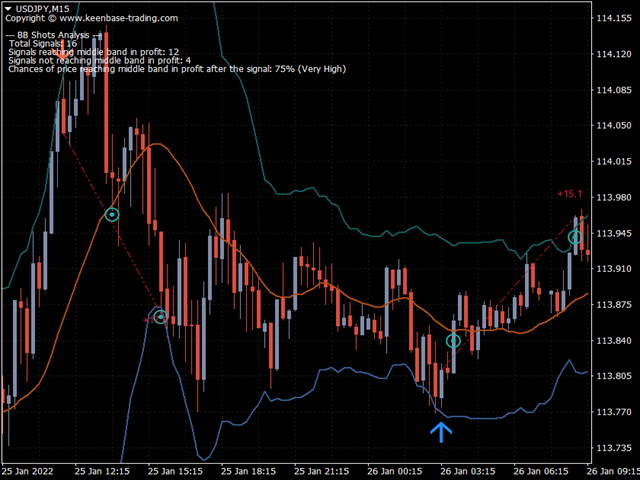
Winning Trade: After a signal, if price touches the middle band in profit, it is considered a winner.
Losing Trade: After a signal, if price touches the opposite band or touches the middle band in loss, it is considered a loser.
!Both scenarios are accounted for in performance metrics and shown on the chart in real-time.
If the probability of price reaching the middle band is 65% or more, it is considered very high due to the self-criticizing nature of the deployed algorithm.
Key Features
- The indicator performs analysis of BB shots signals and shows the probability of the upcoming signals closing in profit.
- Exit points are marked on the chart for each of its signals.
- Real-time analysis of signals statistics using a self-criticizing mathematical model.
- Included the alerts for the possible exits after a signal.
- A vibrant color scheme for better visualization of various indicator events.
- All Metatrader alerts included.
Inputs
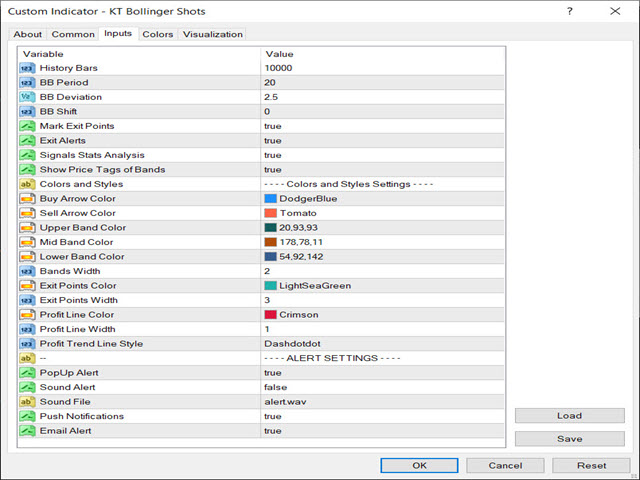
- History Bars: Number of bars to include in the indicator's calculation.
- Bollinger Bands Settings: Period, Deviation, and Shift.
- Mark Exit Points: If true, the indicator marks the possible exit points.
- Exit Alerts: If true, the indicator also send alerts for the possible exit opportunities.
- Signal Stats Analysis: If true, the indicator shows the signal stats and winning probability on the chart.
- The rest of the inputs are self-explanatory.
Developers
double Upper_Band = iCustom(Symbol(),0,"Market/KT Bollinger Bands Shots",0,1);
double Mid_Band = iCustom(Symbol(),0,"Market/KT Bollinger Bands Shots",1,1);
double Lower_Band = iCustom(Symbol(),0,"Market/KT Bollinger Bands Shots",2,1);

double Buy_Signal  = iCustom(Symbol(),0,"Market/KT Bollinger Bands Shots",3,1);
double Sell_Signal = iCustom(Symbol(),0,"Market/KT Bollinger Bands Shots",4,1);


if(Buy_Signal!=0)   // Buy signal detected
if(Sell_Signal!=0) //  Sell signal detected

double Buy_Stoploss = Lower_Band // Can be used as a possible stop loss for a buy trade.
double Sell_Stoploss = Upper_Band // can be used as a possible stop loss for a sell trade.
double Take_Profit = Mid_Band // Can be used as a possible profit target for both buy & sell trade.










Ho acquistato questo indicatore, ma vorrei dei chiarimenti su come adoperarlo. C'e' un manuale o video da visionare per sfruttare al meglio le potenzialità? Mi riservo in seguito di fare una recensione, grazie.