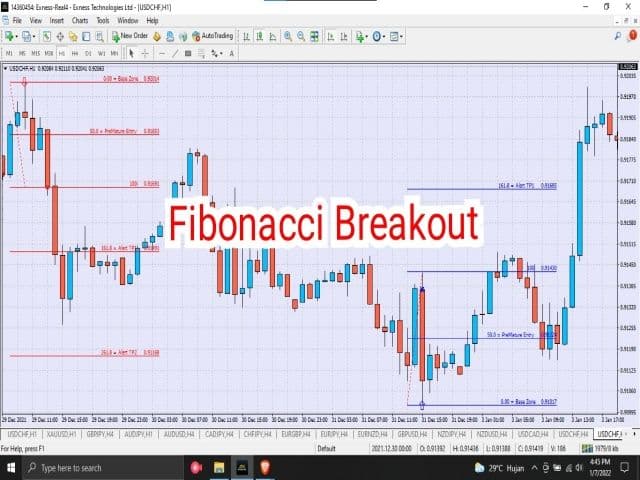
Fibonacci Breakout
- Indicatori
- Agus Putu Gede Wira Adnyana
- Versione: 1.0
- Attivazioni: 5
Fibonacci Breakout è una strategia di trading che utilizza il ritracciamento di Fibonacci. Questa tecnica è in realtà una tecnica per permetterci di entrare all'inizio del trend. È molto facile da capire anche per i principianti.
La strategia è che devi solo aspettare che appaia il Fibonacci personalizzato automatico, quindi inserire manualmente il tuo ordine in sospeso, fermare la perdita e prendere profitto a livello di Fibonacci. La posizione verrà aperta quando il prezzo effettuerà un nuovo test con successo. Breakout di Fibonacci Adatto per Forex, Crypto e azioni.
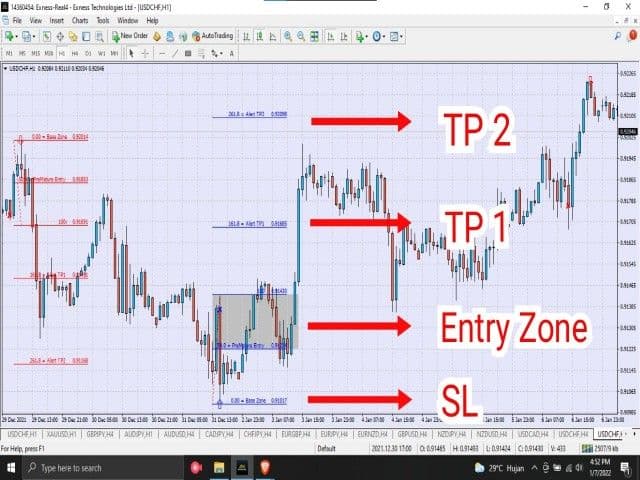
Dettagli del livello di breakout di Fibonacci:
1- Monitor Trade = 0 (può essere un livello di stop loss)
2- Zone di Ingresso = 0.50 – 1.00 (Ingresso quando Il prezzo All'interno della Zona)
3- Prendi le zone di profitto
TP 1 = 1.618
TP 2 = 2.618
TP 3 = 4.236
PROCEDURA OPERATIVA STANDARD (SOP)
• La SOP è molto semplice e di facile comprensione. Il sistema identificherà la presenza di:
1. Break iniziale (IB) o Break dominante (DB)
2. Candle Break 1 (CB1) - contrassegnato con il colore blu o rosso del simbolo X (in realtà punto B del precedente modello ABC)
3. Ritestare (livello di Fibonacci 0.50 – 1.00)
• Quando le 3 condizioni sono soddisfatte, la SOP è completa. Fibonacci apparirà sul grafico per indicare la zona di ingresso (EZ), il livello di take profit (TP) e il livello di stoploss (SL).
• La probabilità di un'operazione di successo è nell'alto percentile ( >80% ) se si segue questa semplice regola SOP & Money Management.
• Mai fare trading contro la tendenza del mercato. Aspetta sempre SOP.
• Finché nessun CS ha chiuso al di sopra del livello Monitor Trade, la SOP è valida.
• Consiglia l'intervallo di tempo 1H e 4H per l'Intraday. Se ti piace lo scalping puoi usare Timeframe 5M.
SUGGERIMENTI SEMPLICI;
1. Per un profitto consistente, prendi sempre profitto al livello TP 1.
2. Sul grafico, guarda a sinistra, se il prezzo ha raggiunto TP 2 o TP 3 di solito il suo ciclo di tendenza completato (tempo di inversione), quindi può anche essere un punto di ingresso in queste zone.
3. Controlla sempre l'andamento con auto fibonacci su intervalli di tempo più alti.
L'indicatore può aiutarti a trovare le migliori opportunità sul mercato con un rischio e un rendimento fino a 1:4. questo ti darà un profitto accumulato alla fine del mese.
devi solo essere disciplinato con il tuo piano di trading e la gestione del denaro. il trading è un'attività ad alto rischio. Tutti i rischi sono sotto la tua responsabilità come trader professionista.

I purchased the indicator because I am always looking for something that may help with Fibonacci. There is not much direction on how the indicator works other than a few pictures. The Vendor says he has no instructional videos at the moment. I say this because the inputs are not your general inputs, but have many options to consider. (which I appreciate but am even more confused) I will have to come back at a later time to update. Right now I have it on the AudJpy 5M chart and not sure what it is doing. I have an red X that turned to a green X. Still hoping for a video with instructions. One of the other concerns is the indicator does not display the 38.2 nor the 61.8. It does have the 50 and the 78.6. Thank you.