MagicLevels
- Indicatori
- Zhanna Petrova
- Versione: 2.0
- Attivazioni: 5
Magic Levels for MT4 by Jeanne Soft
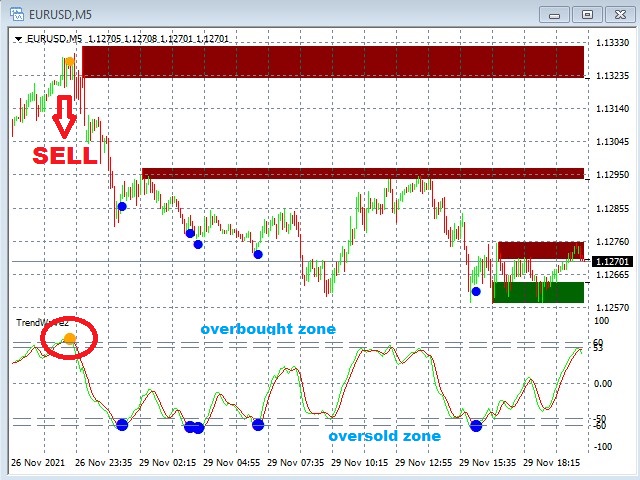
The Magic Levels indicator was created to solve three important tasks of successful trading:
1) construction of the nearest support and resistance levels for the selected timeframe,
2) timely identification of situations when the instrument is overbought or oversold,
3) indication of the probable trend reversal points.
The indicator allows you to significantly save time analyzing the current situation on the selected instrument and contributes to making the right decision on the entry point of the deal.
In the area of horizontal levels there is often a slowdown of movement or market reversal. The Magic Levels indicator allows determining the best market exit points (for setting take profit and stop loss orders) and also entry points when the price rebounds from a higher timeframe level.
The colors of the price zone and the lines highlighting the upper and lower boundaries of the levels can be changed in the settings. Levels of higher timeframes are also displayed on smaller ones. This allows you to see the most important levels without switching between timeframes.
Main advantages of the indicator
- Versatility - levels work for any markets and timeframes.
- Ease of use - most of the indicator settings are color-coded.
- Absolute - unlike many indicators (RSI, Moving Average, Stochastic, etc.) Magic Levels is created based on price, not derived from it.
How levels are built
Experienced traders know that horizontal support and resistance levels have been used in trading for decades. These levels work and will work because traders think they should work and use them in their trading strategies. Levels are built based on candlestick patterns that appear at local market reversal points. They are versatile and do not require adjustments to historical data. The levels of the higher timeframes are displayed on the smaller ones. This allows you to see the most important levels without switching between timeframes.
Indicator settings
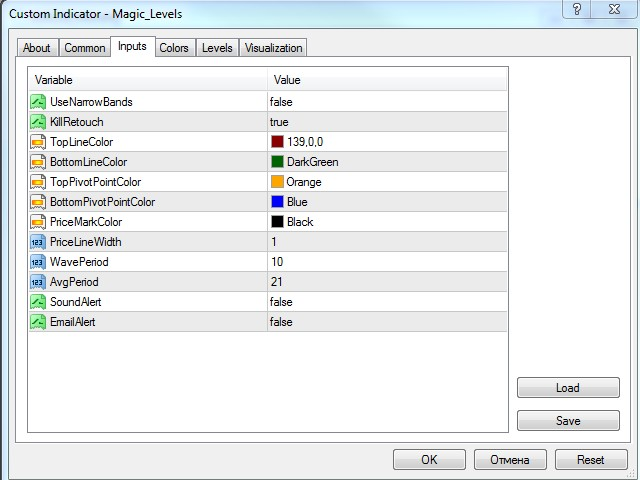
- UseNarrowBands (True/False) – Use narrow support and resistance zones.
- KillRetouch – This setting will delete previous supply and demand levels after they have been touched more than twice. This is because the more number of times a supply and demand area has been tested, the less significant it becomes.
- PriceMarkColor – Color indication of current price label.
- PriceLineWidth – Thickness of the line displaying the current price level.
- WavePeriod – Wave Indicator calculation period (in bars). It is best to select it for a specific instrument.
- AvgPeriod – Averaging period: the larger it is, the smoother the indicator lines will be.
- SoundAlert – True/False, turn on/off the buzzer when circles (pivot points) appear.
- EmailAlert – Notification of trading signals to the e-mail (the e-mail address you specified when you opened an account with the broker is used).
If you have any questions or suggestions you can always contact me via chat.
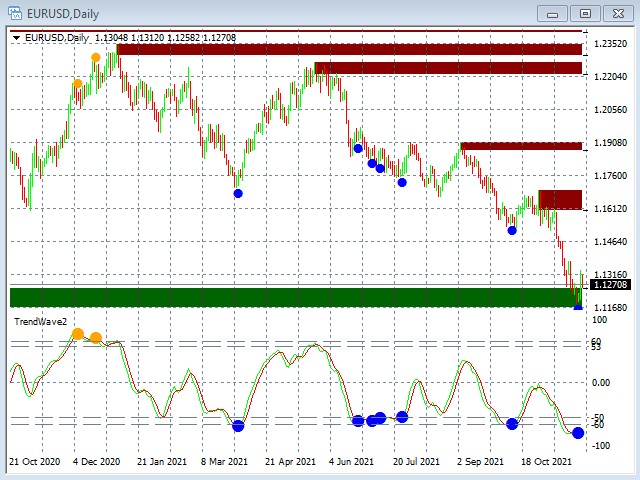

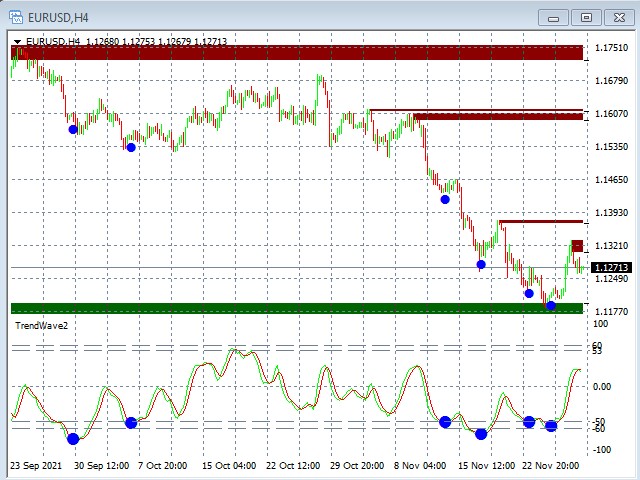
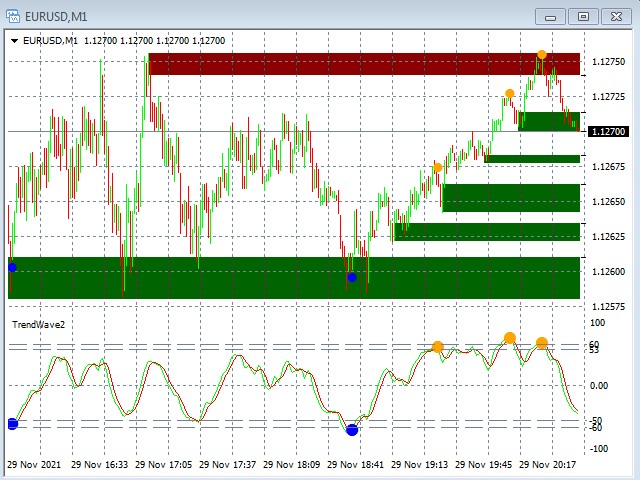
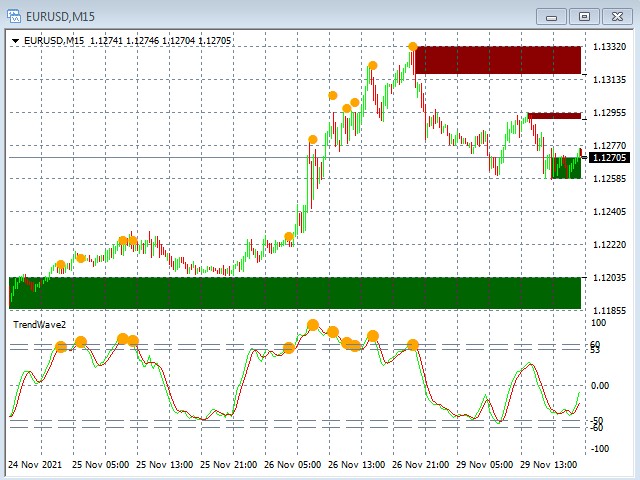


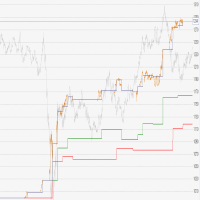







Индикатор показывает зоны покупок или продаж. Помогает в принятии решения при входе в сделку.