MACD With Histogram
- Indicatori
- Wichayuth Chotklang
- Versione: 1.40
- Attivazioni: 10
Peak-Trough Divergence
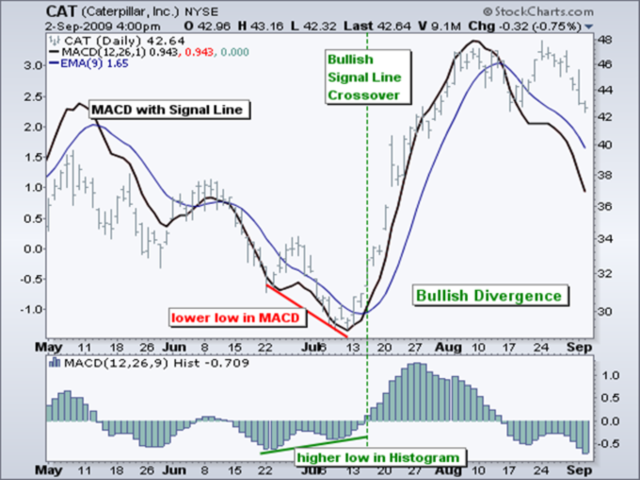
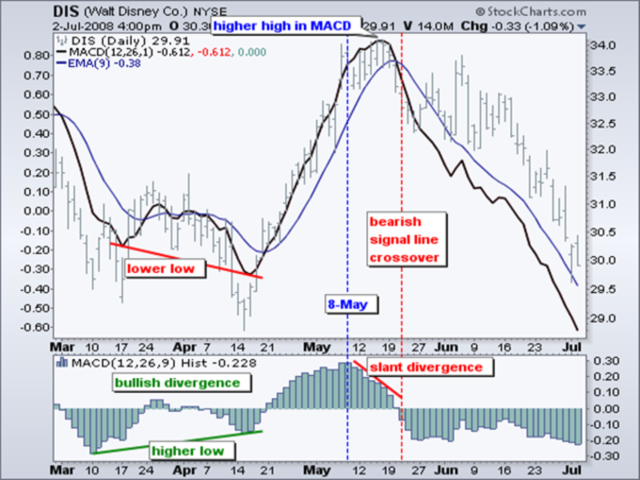
The MACD-Histogram anticipates signal line crossovers in MACD by forming bullish and bearish divergences. These divergences signal that MACD is converging on its signal line and could be ripe for a cross. There are two types of divergences: peak-trough and slant. A peak-trough divergence forms with two peaks or two troughs in the MACD-Histogram. A peak-trough bullish divergence forms when MACD forges a lower low and the MACD-Histogram forges a higher low. Well-defined troughs are important to the robustness of a peak-trough divergence. Chart 2 shows Caterpillar with a bullish divergence in the MACD-Histogram. Notice that MACD moved to a lower low in June-July, but the MACD-Histogram formed a higher low (trough). There are two distinct troughs. This bullish divergence foreshadowed the bullish signal line crossover in mid-July and a big rally.
Slant Divergence
As its name implies, slant divergences form without well-defined peaks or troughs. Instead of two reaction highs, there is simply a slant lower as the MACD-Histogram moves towards the zero line. A MACD-Histogram slant towards the zero line reflects a convergence between MACD and its signal line. In other words, they are getting closer to each other. Momentum shows strength when MACD is moving away from its signal line and the MACD-Histogram expands. Momentum weakens as MACD moves closer to its signal line and the MACD-Histogram contracts. Contracting MACD-Histogram is the first step towards a signal line crossover.
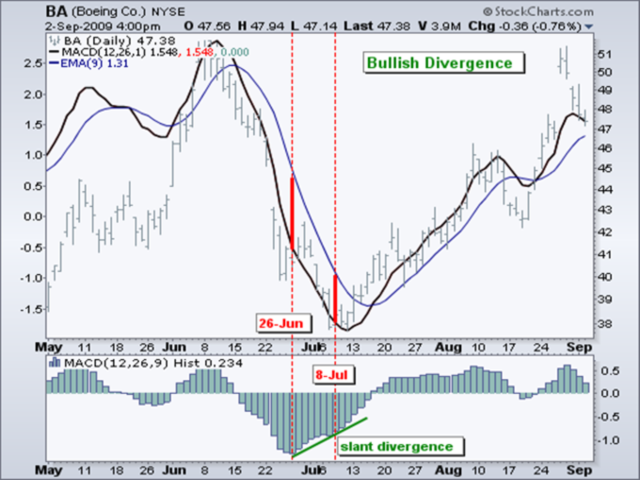
Chart 4 shows Boeing with a classic slant divergence in the MACD-Histogram. MACD moved sharply lower after the bearish signal line crossover in June 2009. MACD moved to a new low in mid-July, but the MACD-Histogram held well above its prior low. In fact, the MACD-Histogram bottomed towards the end of June and formed a bullish slant divergence. The thick red lines show the distance between MACD and its signal line. It is sometimes hard to gauge distance on the chart so these lines highlight the difference between 26-June and 8-July. This slant divergence foreshadowed the bullish signal line crossover in mid-July and a sharp advance in the stock.
