Flat finder MT4
- Indicatori
- Yuriy Lyachshenko
- Versione: 1.0
- Attivazioni: 5
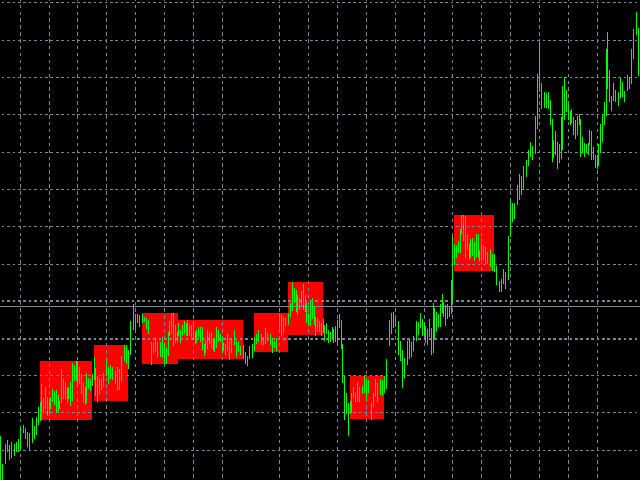
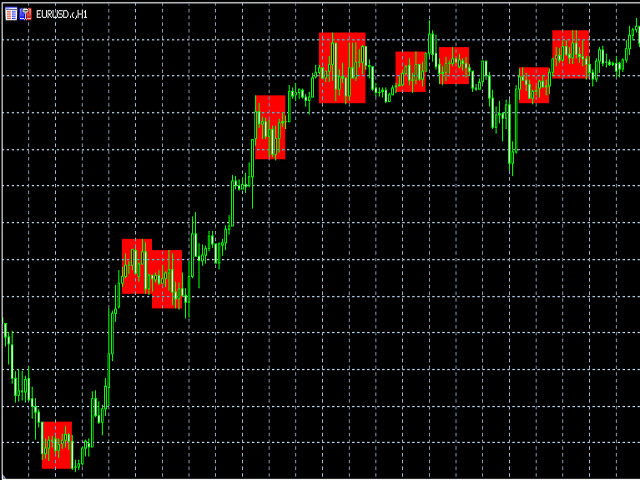
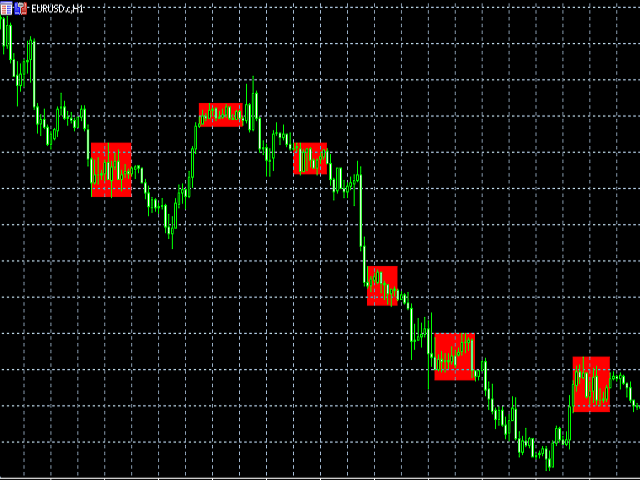
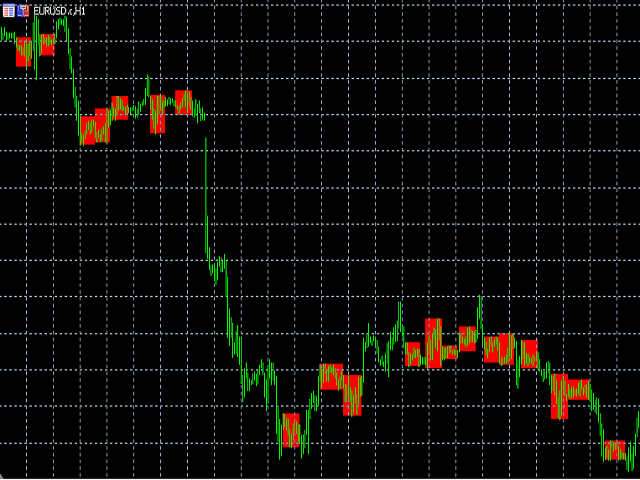
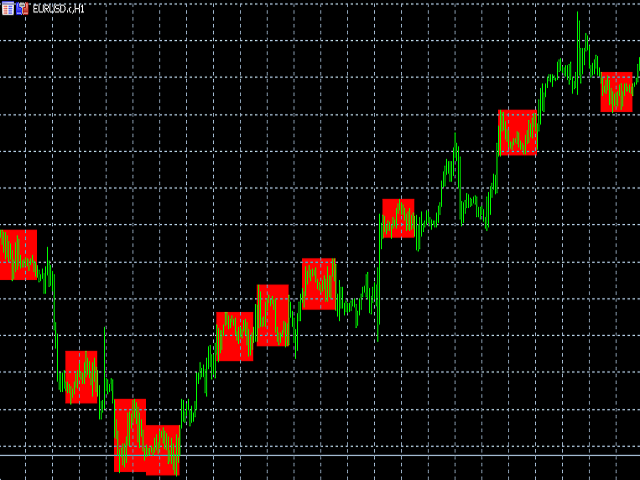
Questo indicatore individua un livello piatto e dipinge l'area individuata con un rettangolo colorato.
L'idea principale di questo indicatore è quella di rilevare una piatta quando il prezzo riempie una certa area del grafico.
Parametri di ingresso:
Color rectangle - colore del rettangolo da ombreggiare.
Bars in rectangle - numero minimo consentito di barre in un rettangolo.
Density in % - densità della piatta, impostata come percentuale dell'area del rettangolo.