ATR dynamic levels
- Indicatori
- Evgenii Bazhenov
- Versione: 1.1
- Attivazioni: 20
ATR dynamic level
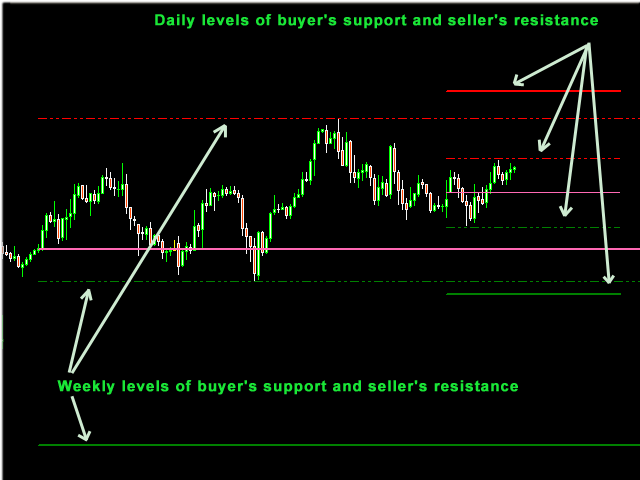
The indicator calculates the price range within which the asset price moved for the specified period of time, and also builds the boundaries of the calculated range for the current week and for today. The levels are calculated from the beginning of the opening of the week (weekly) and from the beginning of the opening of the day (daily).
Features:
1) Support and resistance levels are always relevant, since these levels change along with the price movement. If the price has reached the upper 50% of the line (green dotted line), then the support line (red dotted line) has moved up by the same number of points, thereby forming the current level of support for the buyer.
2) The support lines (TP1, TP2) and resistance lines (TP1, TP2) are built at very strong price levels of professional buyers and sellers.
3) Configurable parameters (daily, weekly ATR levels, ATR period, line color, shift of High and Low lines).
4) Can be used to create an Expert Advisor.
Description:
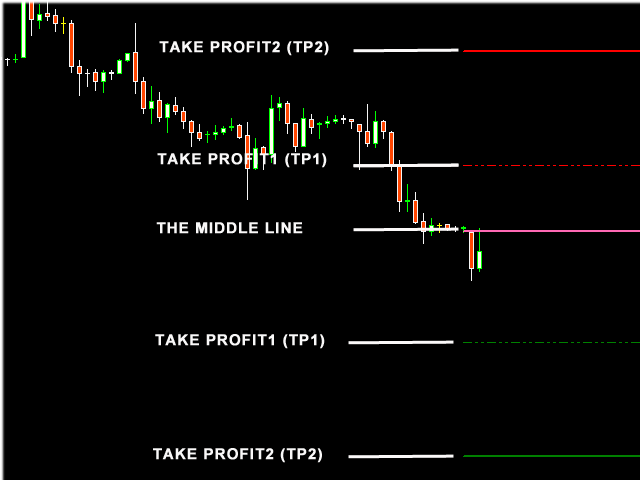
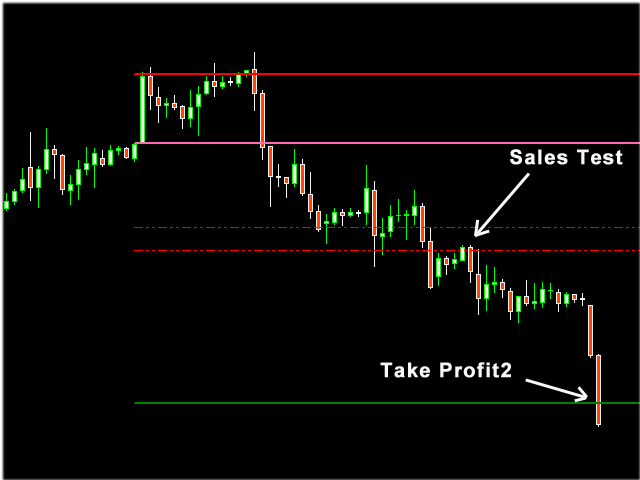
The pink line (zero) is the opening line of the week or day.
The dotted red line (resistance, TP1) is 50% of the range when moving up.
The thick red line (resistance, TP2) is 100% of the range when moving up.
The dotted green line (support, TP1) is 50% of the range when moving down.
The thick green line (support, TP2) is 100% of the range when moving down.
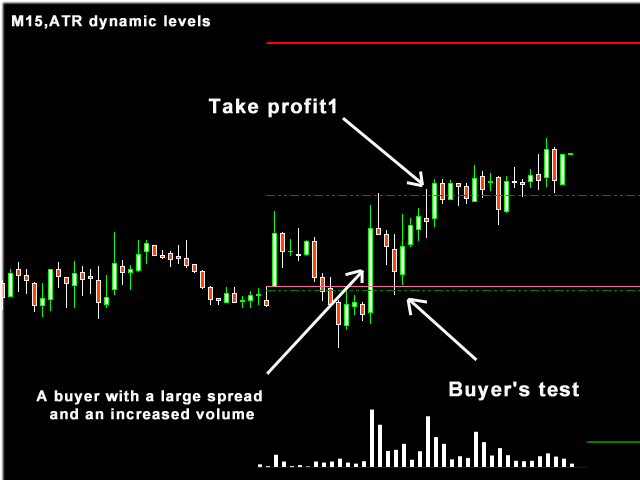
Recommendations for opening a buy position:
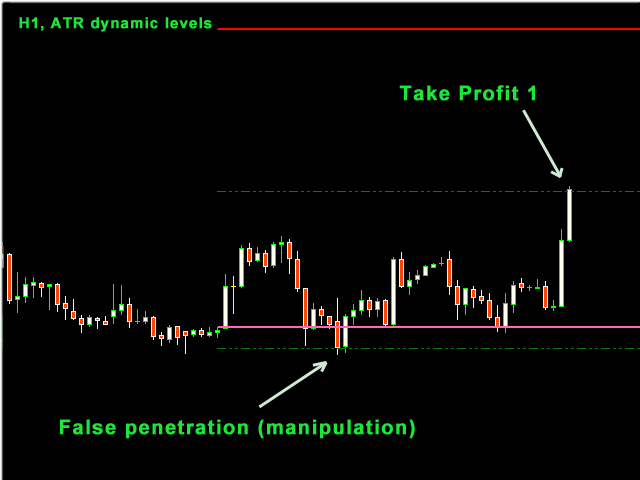
1. At the level of the ATR dynamic level indicator, a Buyer has appeared (a candle or a bar with a large spread and volume).
2. The price came to the buyer's test, forming a support level.
3. The price has tested or manipulated (false breakdown) with the support level.
4. After a test or manipulation on a bullish candle, enter the purchase.
Recommendations for opening a sell position:
1. The price should be below zero (the pink line).
2. At the level of the ATR dynamic level indicator, a Seller appeared (a candle or a bar with a large spread and volume).
3. The price came to the seller's test, forming a support level.
4. The price has manipulated the support level.
5. After manipulating the bearish candle, enter the sale.
Recommendation to close position No. 1
Close the entire position when TP1 is reached.
Recommendation to close position No. 2
Close 70% of the position when TP1 is reached and the remaining 30% when TP2 is reached.
Input parameters
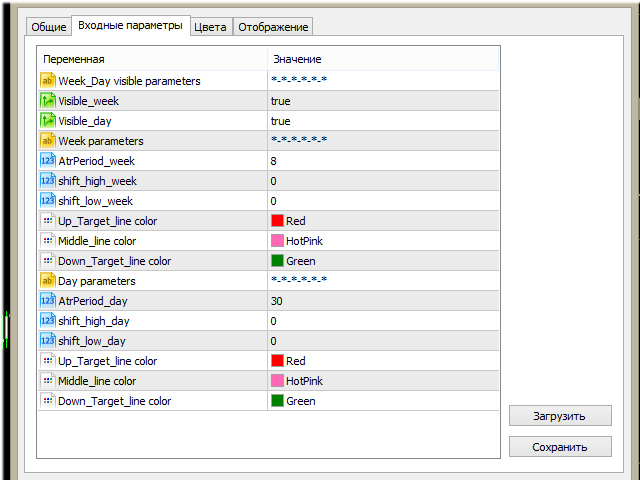
Week_Day visible parameters
Visible_week - Display weekly levels
Visible_day - Display daily levels
Week parameters
AtrPeriod_week - For which period to calculate weekly levels
shift_high_week - How many points to shift the upper weekly level
shift_low_week - How many points to shift the lower weekly level
Color_up - The color of the upper weekly level
Color_middle - The color of the average weekly level
Color_down - The color of the lower weekly level
Day parameters
AtrPeriod_week - For which period to calculate the daily levels
shift_high_week - How many points to move the upper daily level
shift_low_week - How many points to shift the lower daily level
Color_up - The color of the upper daily level
Color_middle - The color of the average daily level
Color_down - The color of the lower daily level













Благодарочка За отличную работу! А на МТ4 сможешь переписать?