• Panoramica
  • Recensioni (5)
  • Commenti (8)
  • Novità

IVISTscalp5

5

What's new about iVISTscalp5 forecast indicator (Version 10)?


iVISTscalp5 is a unique nonlinear forecasting for a week ahead system for any financial instrument which executes fast scalping using time levels.

iVISTscalp5 is a tool for easy study and understanding of financial market.

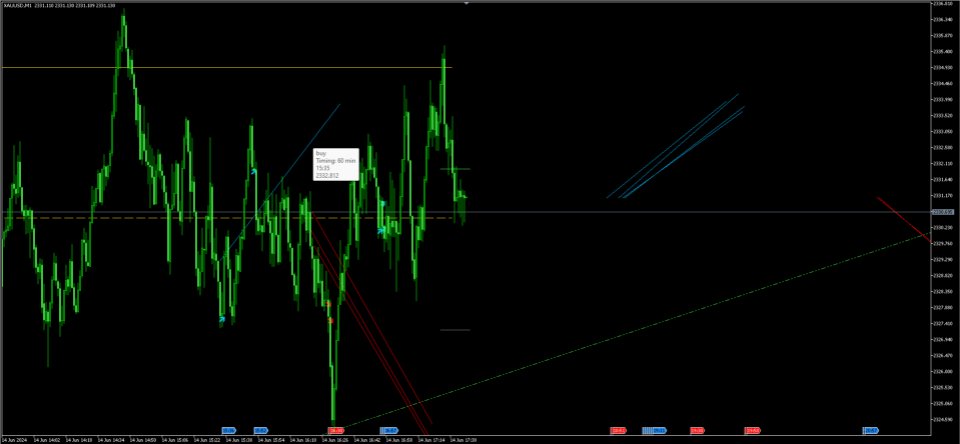
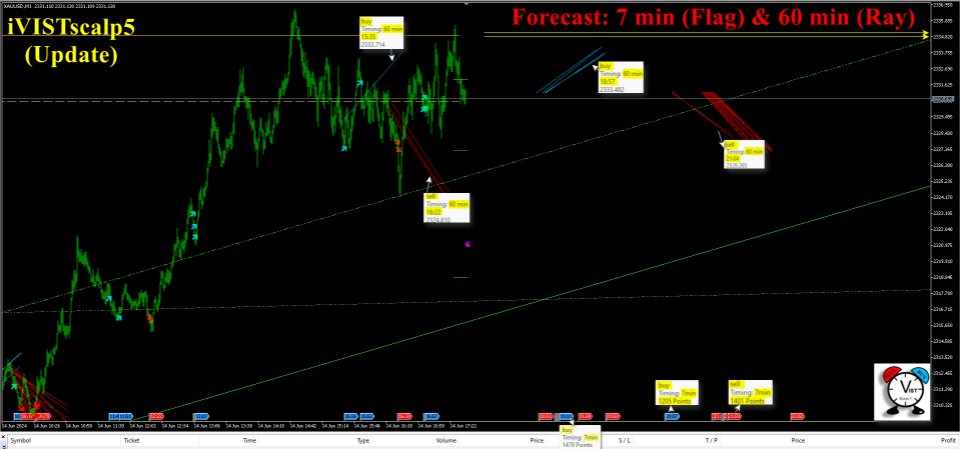
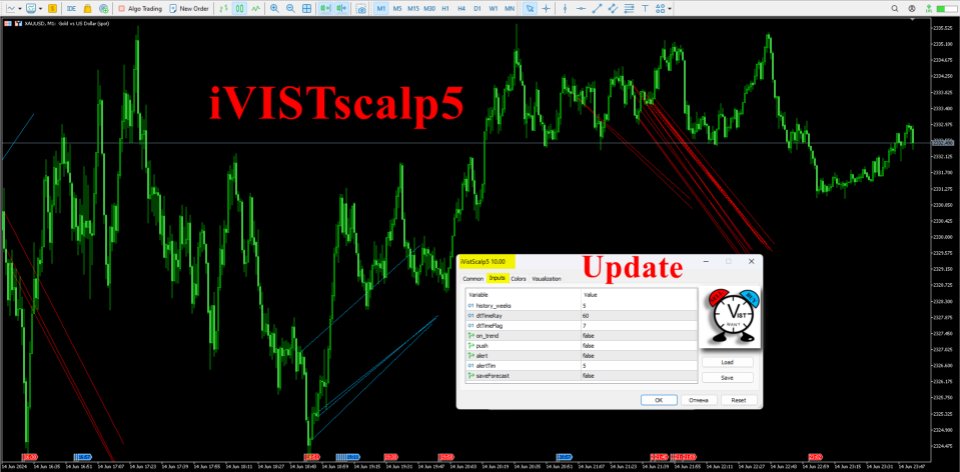
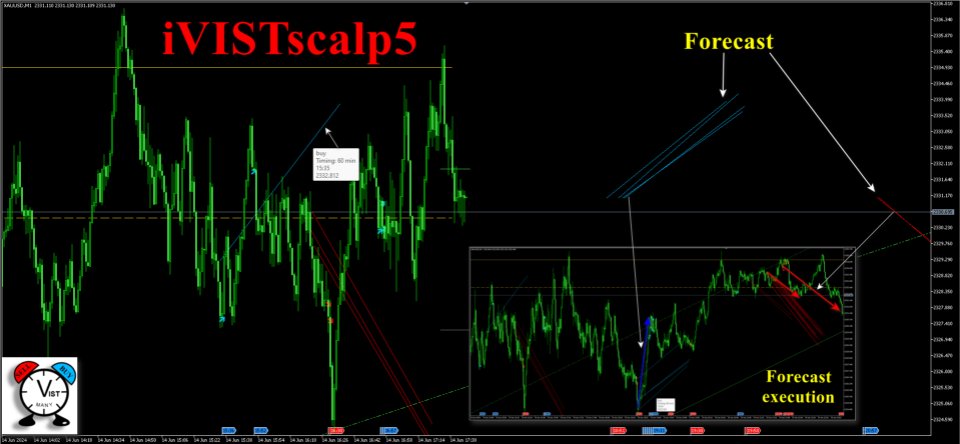
1) iVISTscalp5 forecast indicator has been completely rewritten into another programming language (C++), which has accelerated data loading and processing. As a result, a different graphical display of forecasts on the chart will be easier to understand, study and work with. Mathematics and methods of calculating forecasts remained unchanged. Basic rules for using the indicator have remained the same as well. In the new version of iVISTscalp5 indicator, two types of forecast are presented on the chart: Rays and Flags. Forecast in the form of Rays is calculated for a day ahead; forecast in the form of Flags is calculated for a week ahead. The pips/points counter refers to timings (forecasts) in the form of Flags.

2) The settings of iVISTscalp5 indicator have been optimised and simplified. We recommend using iVISTscalp5 indicator by default for any financial instrument (you only need to change the first parameter "history_weeks" to number 8 for the first and the last week of the month). Our recommendation in parentheses is for more novice traders.

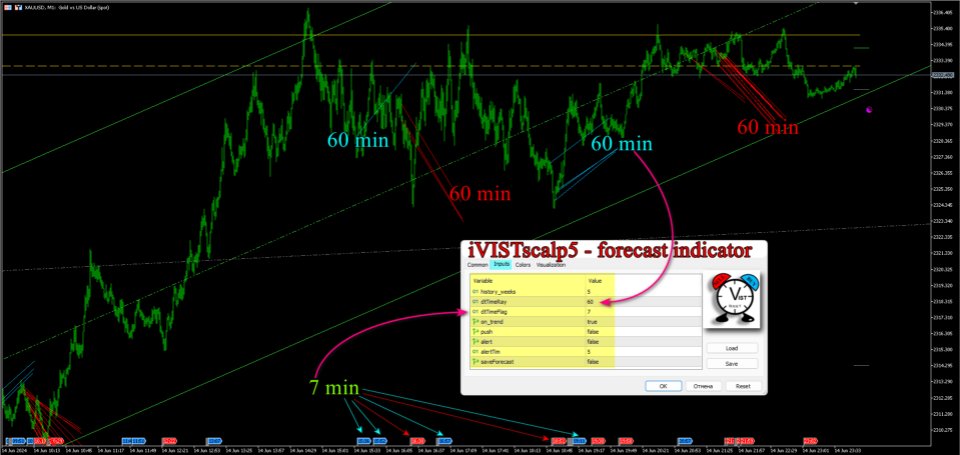
3) In the new version of iVISTscalp5 indicator, there are two forecasts calculated on the chart at the same time. The default is for 60 minutes and for 7 minutes. So that, from the chart in the range of 60 minutes or 7 minutes with 95% probability, you will be able to see how and at what time price will change, and what average profit can be obtained.


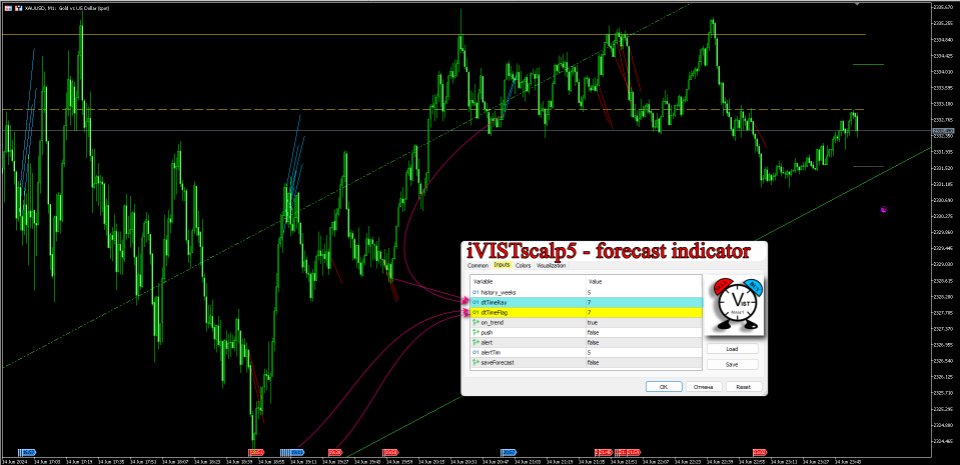
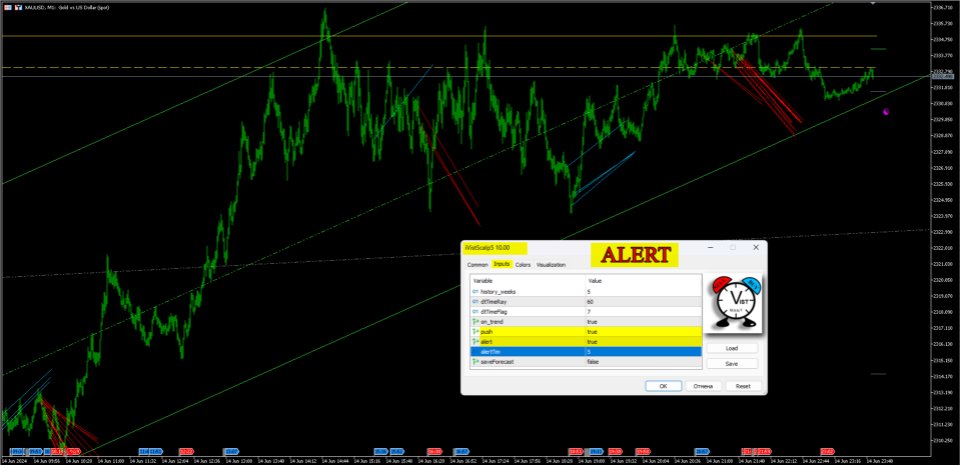
Description of iVISTscalp5 indicator settings

history_weeks – the number of weeks of quote history for calculating forecasts. We do not recommend setting less than 5. Values 5 and 8 work best. The values are related to the duration of options and futures contracts.

dtTimeRay – the time interval for calculating forecasts (timings).

dtTimeFlag – the time interval for calculating forecasts (timings).

on_trend – displaying the main price levels and channels (true/false).

push – the ability to use push notifications (true/false).

alert – notification in mt5 terminal (true/false).

alertTim – setting the time for push notifications and alerts (minutes).

saveForecast – the forecast for the week ahead in text form (true/false).


4) In the new version of iVISTscalp5 indicator, there are two types of forecasts presented on one chart. The first one is for fast scalping (7 minutes/ 5 weeks), as it was included in the previous version of the indicator. The second type (new) is Rays on the chart, which show the forecast of the price movement trend (60 minutes/5 weeks). Rays (forecasts) move behind the price on the chart until their time of action is suitable. Ray’s length is the average forecast of the profit of a financial instrument.

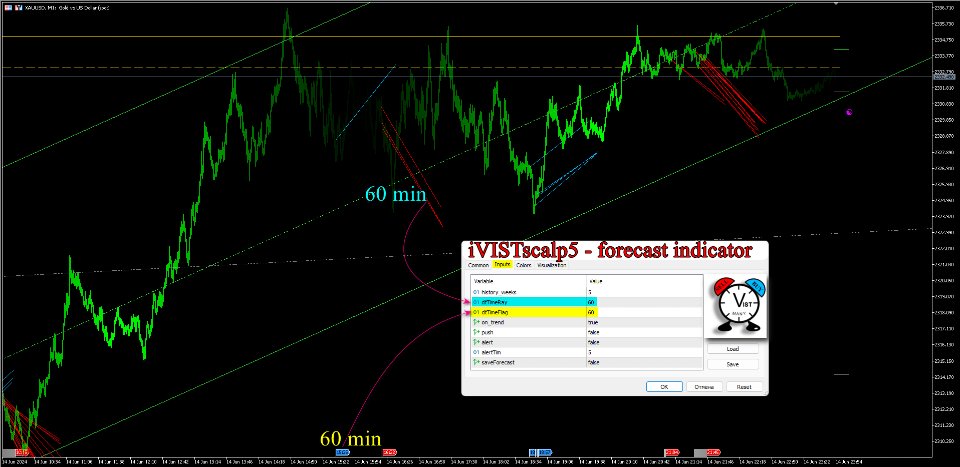
 5) Forecasts in the settings of the iVISTscalp5 indicator can be swapped. In the parameters where the Rays are, settings are for 7 minutes, and in the parameters where the Flags are,  settings are for 60 minutes (or forecasts for other time intervals). You can choose your own way as it’s convenient for you.

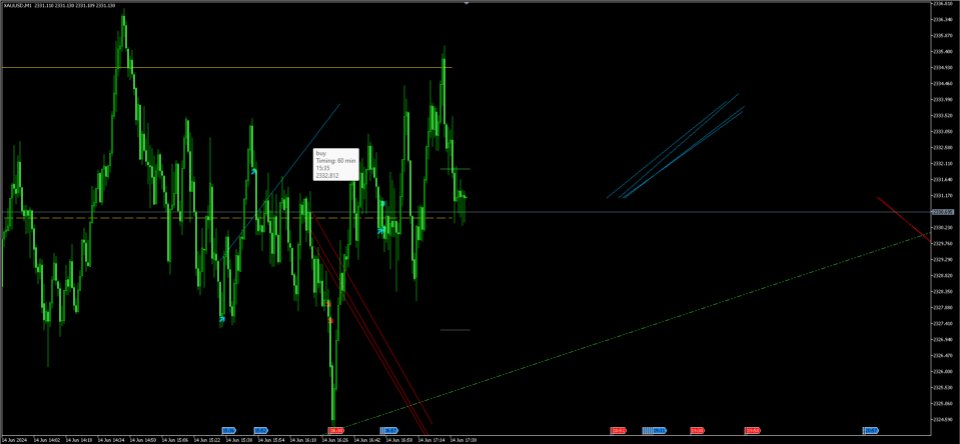
 6) You can set a forecast for one time interval in the indicator parameters. To do this, you need to set the same time value in "dtTimeRay" and "dtTimeFlag" parameters. For example, if you want to get a forecast for a financial instrument in a time interval of 7 minutes (photo above), then the visualisation of the average profit will be in the form of a Ray. In this case on the Flag you will be able to see the forecast time (timing). With this type of parameters you can immediately determine what amount of profit you are able to get. It is very convenient for quick analysis and work.

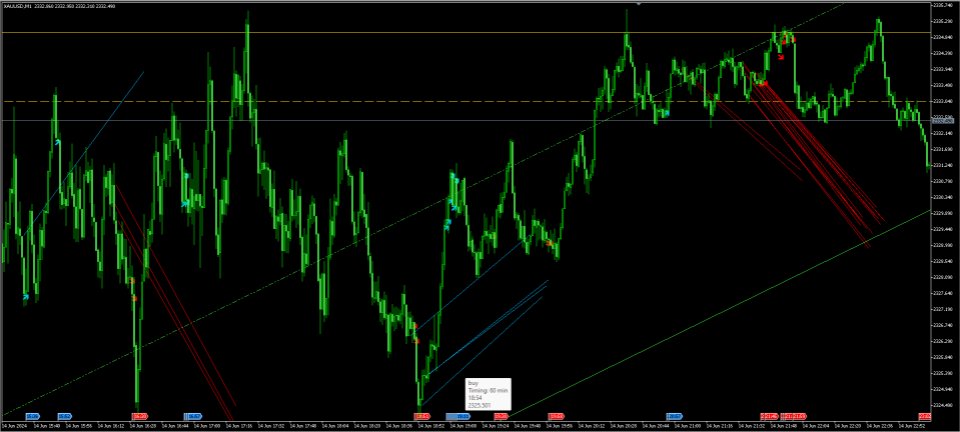
 Photo above shows an example of the same forecast for a financial instrument with two types of visualisation (Ray and Flag). In this case "dtTimeRay" and "dtTimeFlag" parameters specify the calculation of forecasts of iVISTscalp5 indicator for the same value of the 60-minute time interval.

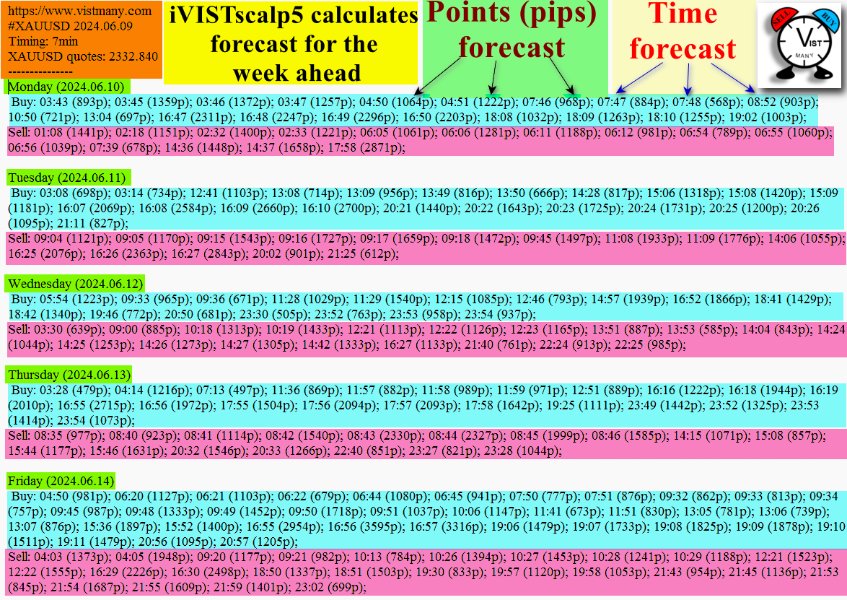
7) All forecasts in iVISTscalp5 indicator can be obtained in text form for a week ahead. The new version adds dates to the days of the week. So that before the upcoming trading week you already know all the forecasts in advance by time and by the average profit size. When installing the iVISTscalp5 indicator on the chart, in order to get the forecast in text form set the value "true" in front of "saveForecast" parameter. The forecast is located in "Files" folder. The path to the Folder: File→Open Data Folder→MQL5→Files→Forecast_text.

8) All spectra of forecasts (timings) are displayed on the screen. Previously, it was necessary to hover the mouse over the flag to see the forecast spectrum (timing strength). In this version of the indicator, all forecasts are displayed on a chart. Therefore, in the new version, you can see concentrated spectra of forecasts on the chart, which differ from each other by 1-2 minutes. The spectra enhance the forecast.


 9) Information on the forecasts of the iVISTscalp5 indicator can be seen if you move the mouse to Ray or Flag.

1. The red color is the sell forecast. The blue color is the buy forecast.

2. The following information is indicated inside each timing in the form of a ray (forecast):

1) Buy or sell forecast.

2) Timing is the time interval for which forecasts are calculated. The photo shows 60 and 7 minutes.

3) The predicted BUY or SELL time. These are forecasts in the form of a Ray. On the forecasts in the form of Flags, you can immediately see the time.

4) The value of the price level at the moment.

5) The Ray’s length is the average profit forecast. The average profit forecast in the form of a Flag can be seen as a numeric value in pips/points if you bring the mouse to it.


Let's summarise all the updates of iVISTscalp5 indicator (Version 10)

1. iVISTscalp5 indicator is designed to calculate forecasts by time levels (timings) and get BUY or SELL forecast time. You get a forecast of the average profit which can be obtained at the time intervals specified in "dtTimeRay" and "dtTimeFlag" parameters.

2. The corresponding graph shows two types of forecasts at the same time. By default, the length of time forecasts is 7 minutes and 60 minutes. Forecasts of 60 minutes show the main trend in the movement of the instrument in a given time interval. The forecast for 7 minutes is a short forecast for fast scalping. Make sure to follow the basic rules of the forecast system!

3. We recommend using iVISTscalp5 indicator with default parameters to calculate forecasts for any financial instrument.

4. Forecasts in the form of Flags are time forecasts for the week ahead. Forecasts in the form of Rays are time forecasts for the day ahead.

5. Forecasts of iVISTscalp5 indicator for a week ahead can be obtained in text form for any financial instrument.

6. Several iVISTscalp5 indicators with different parameters can be installed on one chart. In this way you can simultaneously get four or more forecasts with different time intervals.


We present you the iVISTscalp5 indicator, which is not only unique, but also effective in the analysis of trading operations. This indicator is based on time data and is the result of many years of experience and deep analysis of financial markets. The iVISTscalp5 indicator is an excellent assistant for manual trading. Convenience, simplicity and visualization. All the most difficult is hidden inside. We have simplified the settings and use of the iVISTscalp5 indicator as much as possible. The indicator is suitable for all financial instruments that you have in the MT5 terminal.

Working hours with timings from 4 am to 20 pm (UTC+3).


The red and blue flags on the chart represent timings (signals of the VIST intelligent scalping system). The sell signal is red flags, the buy signal is blue flags.

The execution time of the presumed timing is written on each flag. Inside each timing, there is information about the points that the price should pass according to the calculations. If there are very few points, then this timing is ignored. Duplicate timings of the same color enhance the signal. In this case, you need to look for a better entry point around it.

The maximum efficiency of working with timings is 2-3 financial weeks of the month. But this does not mean that timings do not work at the beginning and end of the month. In the first and last week of the month, there are more fluctuations in the market. As a result, the timing of the triggers may increase.

News that greatly affects the market can also affect the timing of triggers.

  1. For optimal timing operation, some adjustments need to be made to the MT5 terminal. Go to Service - Settings - Charts - "Maximum bars in window" and select "Unlimited".

  2. Manually load quotes for the financial instruments you work with. For example, let's take the XAU/USD pair.

    Go to View - Symbols - Specification - find XAU/USD - choose bars - select timeframe M1 - load quotes for the last six months. To do this, set the date range - click "Request". Do the same for ticks.

    You may ask why we need to do this. This is to speed up the calculation of timings in the iVISTscalp5 indicator.

There are several tools available in our proprietary

VIST timing system:

1. There are the following tools according to our author system:

Demo version of VistScalp5 for MT5. Take your time, understand everything carefully.If you are a beginner, then you will need at least a month of training to work with timings.

The iVISTscalp5 indicator for MT5 is rented monthly, except that it can be bought. This opens up opportunities for all the tools that are available in MT5. We call these products the trading laboratory. You can choose any parameters for trading and any instrument. The iVISTscalp5 indicator provides trading signals (timings) that you will pick up. There is an automatic mode where the indicator gives optimal values. When working with the indicator, great opportunities for market research open up.

2. Intraday trading, scalping (working out 7-60 minutes). Sometimes it takes longer. News, expiration, geopolitics.

3. The VIST system is designed for any level of trader.

4. Whether you use the free script VistScalp5 or the iVISTscalp5 indicator, they are both based on the same proprietary method. The free script has limited capabilities in terms of using financial instruments (there are only a few available). The iVISTscalp5 indicator can be used on all financial instruments available in your terminal. The indicator automatically adjusts to the time of your terminal.

5. In the indicator, for the instruments you specify, there is a text file with a forecast for the next week. Path: MQL->File->Text file. It may be useful for someone to print out all the signals.

6. Timings (trading signals) are great assistants in your work.

7. It can be applied to binary options.

8. The blue flag indicates a BUY signal, while the red flag indicates a SELL signal. The entry time is indicated on each flag.

9. In the iVISTscalp5 indicator, you can see on the flag how many pips of profit can be obtained from the timing signal.

10. The iVISTscalp5 indicator has a pre-set trader alarm clock.

11. The timing entry error is approximately plus or minus three minutes. It is necessary to look for the best entry point in the vicinity.

12. If the price has made a significant movement in one direction, do not enter the timing in that direction, if there is one.

13. Watch for support levels (do not enter sell timing) and resistance levels (do not enter buy timing).


    Manipulations in the trading system are still a possibility. Our trading hours are from 4:00 to 20:00. We do not trade on Fridays and during quarterly expirations. It is better to skip Thursdays and Fridays in the first and last week of the month. It is also recommended to avoid trading during important news releases until you have thoroughly studied the system and gained experience in trading.

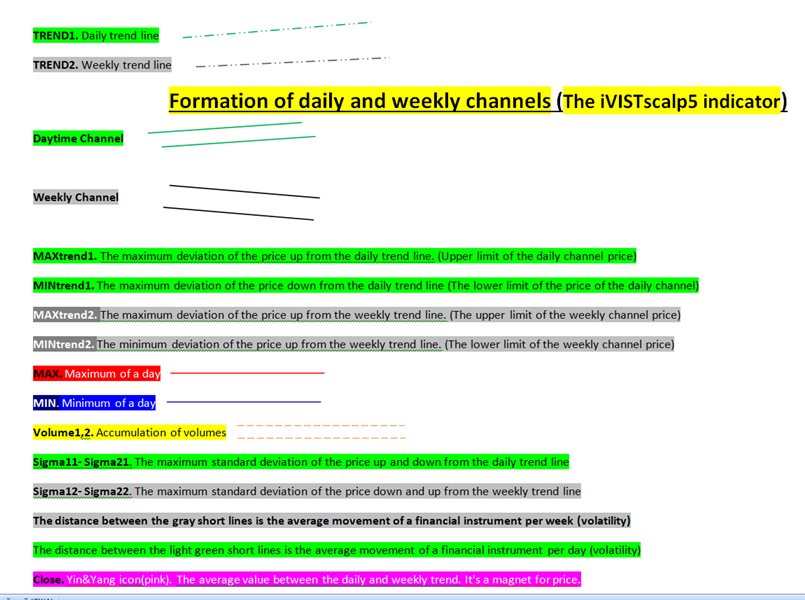
Parameter designations for the chart:

TREND1 - Daily trend line.

TREND2 - Weekly trend line.

MAXtrend1 - Maximum price deviation above the daily trend line (Upper boundary of the daily channel).

MINtrend1 - Maximum price deviation below the daily trend line (Lower boundary of the daily channel).

MAXtrend2 - Maximum price deviation above the weekly trend line (Upper boundary of the weekly channel).

MINtrend2 - Minimum price deviation above the weekly trend line (Lower boundary of the weekly channel).

MAX - Daily maximum.

MIN - Daily minimum.

Volume1,2 - Volume accumulation.

Sigma11 - Sigma21 - Maximum standard deviation of price above and below the daily trend line.

Sigma12 - Sigma22 - Maximum standard deviation of price below and above the weekly trend line.

The distance between the gray short lines represents the average weekly movement of the financial instrument (volatility). The distance between the green short lines represents the average daily movement of the financial instrument (volatility).

Balance - Yin & Yang symbol (pink). The average value between the daily and weekly trend. It acts as a magnet for the price.

The basic rules of trading on the VISTmany forecasting system


1. Discipline is the foundation of a trader!!! We go by timing and take into account the main price levels. VISTmany forecasting systems are presented in three products: on our website, in the iVISTscalp5 indicator (the MetaTrader 5 trading terminal) and the ScalpAuT trading advisor (the MetaTrader 5 trading terminal). If you want to quickly master trading according to time forecasts, be sure to test the iVISTscalp5 indicator a lot in the mt5 terminal strategy tester (MetaTrader 5).

2. On our VISTmany website, timings are indicated by red and blue circles. The points/pips forecast for timings on the site is presented in the form of red (sell) and blue (buy) histograms under the graph. 

3. The red flag in the iVISTscalp5 indicator (the MetaTrader 5 trading terminal) is the sell timing forecast. The blue flag is buy. The forecast of the timing and movement strength (points/pips) is located inside each timing. You need to move the mouse over the timing to get the information.

4. The forecast of timings in the iVISTscalp5 indicator is calculated for the week ahead. Before opening a trading order, we must analyze the timings that were previously available. We are conducting an analysis of forecasts that are ahead of time. We evaluate the forecast based on a combination of timings.

5. Remember that our system is a quick deal. Usually during the timing, an impulse occurs, according to which we should get a profit and close the deal. If you have trading experience, then you can hold the trade to get the desired profit. It is better for novice traders to follow the rules of the system clearly.

6. One of the basic rules of our forecasting system is not to open a sell timing order at the minimum of the day (at the minimum of the daily or weekly channels). Do not open a buy timing order at the maximum of the day (at the maximum of the daily or weekly channels). The iVISTscalp5 indicator has all the necessary price levels and channels for effective analysis and trading. If you do not use our iVISTscalp5 indicator, then plot all the necessary levels and channels on the chart yourself.

7. One more important rule can be highlighted: if there was a drop in the price of a financial instrument before the sell timing, we ignore this forecast. If there was a price increase before the buy timing, we ignore this forecast. In such cases, you can do something else. If there was a drop in the price of a financial instrument before the sell timing, it is according to this time forecast that we do not open an order. We are waiting for the nearest upper price level and only then open the sale. We do the same if there was a price increase before the buy timing. We are waiting for the nearest lower price level of a financial instrument and only after that we open a purchase. The only exception is paragraph 6. The iVISTscalp5 indicator has all the necessary levels for the scalper to work effectively.

8. The most effective trading weeks are 2 and 3.

9. Analysis of the forecast by the number of points/pips in each timing (the number of pips / points can act as a take profit). You determine the stop loss yourself.

10. Analysis of the nearest levels and trend lines of the iVISTscalp5 indicator. (https://t.me/vistmany/1405 , https://t.me/vistmany/1397 )

11.   Double timings are timings that differ from 2 to 6 minutes. For example, buy 17:11 and buy 17:15. Their time difference is 4 minutes. Another example, sell 14:30 and sell 14:36. The time difference is 6 minutes. These are examples of double timings. If the first forecast of the two has worked, we ignore the second timing. (https://t.me/scalpvist/432) Quite often, double timings indicate that there will be momentum in their direction in the near future. Keep an eye on the main price levels and channels. Consider the power of timings. It is important not to trade on double buy timings at the maximum of the day (or at the maximum of the daily and weekly channels). We ignore the double sell timings at the minimum of the day (or at the minimum of the daily and weekly channels). Otherwise, in such cases, you can do as described in paragraph 7 of this article. The only exception is paragraph 6. You always need practice and training on a demo account. Don't ignore the practice process. This is very important for developing scalping skills.

12.   Consider the range of timings (3-5 timings in a row of the same color). Consecutive forecasts in red or blue (sell timings are a red flag, buy timings are a blue flag in the iVISTscalp5 indicator) tell us that there will be an impulse towards timings. Most often, such situations occur before important news. The price has been flat for a long time, and on the news, the entire range of timings of the same color works out in one pulse. We know all the forecasts for the week ahead, so use a cluster of timings of the same color for analysis to make the right decisions. At the same time, we must remember the rule written in paragraph 6.

13.   It's time for the main news. Quarterly expirations.

14. The opening and closing time of the exchanges (At this time, take into account not only the timings, but also the main price levels). Do not trade during clearing.

15.   Monthly expiration dates (Do not trade every third Thursday of the trading week. Usually, after this day on Friday, it is also better to refrain from trading on timings).

16. Before important news, the price is often flat. Timings are not partially fulfilled. Keep a close eye on the market before the most important news. If the timings do not work, it means that we expect a big spike in volatility ahead, while all timings will be worked out. Evaluate price levels, not just time levels, in order not to wait a long time for the timing forecast to be fulfilled. Take a profit according to the forecast two times less than the indicator calculated.

    Let's make a small conclusion. You can always trade according to the forecasts of the VISTmany system. This requires knowledge and practice. Test the iVISTscalp5 indicator. Analyze and record key situations of a combination of forecasts. Patience and sustainability in development! Good luck to all and profit!

Recensioni 5
TheKnowledgeSeeker
46
TheKnowledgeSeeker 2024.06.19 16:35 
 

Thanks to the VIST Trading System, I now have a significant edge that many other traders might not possess. While I aim to become proficient in manual trading, as a developing trader, I often find myself constrained by time. VIST helps me stay on track and not fall behind in my progress. The system offers a wide array of indicators that greatly enhance my understanding of price movements, trends across different time frames, and reactions at various price points. It also provides valuable insights into price volume. Overall, VIST has dramatically sharpened my trading skills, making it an indispensable tool, especially for beginners like myself who are looking to gain a competitive advantage in the market.

evans.ocansey.doe
19
evans.ocansey.doe 2024.06.11 15:33 
 

This indicator is highly accurate, and the support I receive from the creator is outstanding. The developers don't just leave you after purchasing the indicator; they are also willing to guide you on how to use it to achieve consistent profits. I have been extremely impressed with the consistent success I've experienced so far. Therefore, I highly recommend this indicator to everyone, whether you are just starting to trade or are a professional trader. The combination of accuracy and dedicated support makes it an invaluable tool in any trader's arsenal.

Marco Fiaes
92
Marco Fiaes 2024.04.10 04:28 
 

je donne mon avis sur ce produit, je vous le recommande fortement je trouve mieux qu'un robot. merci encore pour ce produit.

Prodotti consigliati
Il livello Premium è un indicatore unico con una precisione superiore all'80% delle previsioni corrette! Questo indicatore è stato testato dai migliori Specialisti di Trading per più di due mesi! L'indicatore dell'autore che non troverai da nessun'altra parte! Dagli screenshot puoi vedere di persona la precisione di questo strumento! 1 è ottimo per il trading di opzioni binarie con un tempo di scadenza di 1 candela. 2 funziona su tutte le coppie di valute, azioni, materie prime, cript
Owl Smart Levels MT5
Sergey Ermolov
4.31 (39)
Versione MT4  |  FAQ L' indicatore Owl Smart Levels è un sistema di trading completo all'interno dell'unico indicatore che include strumenti di analisi di mercato popolari come i frattali avanzati di Bill Williams , Valable ZigZag che costruisce la corretta struttura a onde del mercato, e i livelli di Fibonacci che segnano i livelli esatti di entrata nel mercato e luoghi per prendere profitti. Descrizione dettagliata della strategia Istruzioni per lavorare con l'indicatore Consulente-assistente
Noize Absorption Index - is the manual trading system that measures the difference of pressure between bears forces and bulls forces. Green line - is a noize free index that showing curent situation. Zero value of index shows totally choppy/flat market.Values above zero level shows how powerfull bullish wave is and values below zero measures bearish forces.Up arrow appears on bearish market when it's ready to reverse, dn arrow appears on weak bullish market, as a result of reverse expectation.
SolarTrade Suite Financial Indicator: Venus Market Indicator - La tua guida affidabile nel mondo dei mercati finanziari! Questo è un oscillatore che utilizza speciali algoritmi innovativi e avanzati per calcolare il suo valore e ha anche un design gradevole alla vista. È molto facile capire le letture di questo indicatore: colore blu - acquisto, rosso - vendita. Più luminoso è il colore, più forte è il segnale. Dai un'occhiata agli altri nostri prodotti della serie SolarTrade Suite in f
KopierMaschine - локальный копировщик сделок между различными счетами MetaTrader 4 и MetaTrader 5 в любом направлении расположенных на одном компьютере с интуитивно понятным интерфейсом. Направления копирования: MT4 --> MT5 MT4 --> MT4 MT5 --> MT5 MT5 --> MT4 для копирования между терминалами MetaTrader 4 и   MetaTrader   5 необходимо приобрести версию продукта   KopierMaschine  для    MetaTrader  4 Особенности Программа работает в двух режимах Master и Slave На один подчиненный счет можно коп
L'indicatore costruisce le quotazioni attuali, che possono essere confrontate con quelle storiche e su questa base fanno una previsione del movimento dei prezzi. L'indicatore ha un campo di testo per una rapida navigazione fino alla data desiderata. Opzioni: Simbolo - selezione del simbolo che visualizzerà l'indicatore; SymbolPeriod - selezione del periodo da cui l'indicatore prenderà i dati; IndicatorColor - colore dell'indicatore; HorisontalShift - spostamento delle virgolette d
Your Trend Friend
Luigi Nunes Labigalini
5 (1)
The trend is your friend! Look at the color of the indicator and trade on that direction. It does not  repaint. After each candle is closed, that's the color of the trend. You can focus on shorter faster trends or major trends, just test what's most suitable for the symbol and timeframe you trade. Simply change the "Length" parameter and the indicator will automatically adapt. You can also change the color, thickness and style of the lines. Download and give it a try! There are big movements
This is a multi-symbol and multi-timeframe table-based indicator designed for a candlestick patterns detection with 46 patterns for META TRADER 5. Each formation has own image for easier recognition. Here you find most popular formations such as "Engulfing", "Hammer", "Three Line Strike", "Piercing" or Doji - like candles. Check my full list of patterns on my screenshots below. Also you can not only switch all bearish or bullish patterns from input, but also select formation for a specified symb
Mine Farm
Maryna Kauzova
5 (1)
Mine Farm is one of the most classic and time-tested scalping strategies based on the breakdown of strong price levels. Mine Farm is the author's modification of the system for determining entry and exit points into the market... Mine Farm - is the combination of great potential with reliability and safety. Why Mine Farm?! - each order has a short dynamic Stop Loss - the advisor does not use any risky methods (averaging, martingale, grid, locking, etc.) - the advisor tries to get
Gyroscope        professional forex expert   (for EURUSD, GBPUSD, USDJPY, AUDUSD, USDCHF, EURGBP, EURJPY, NZDUSD, USDCAD, EURCHF, AUDJPY, CADJPY pairs)   alyzing the market using the Elliot Wave Index. Elliott wave theory is the interpretation of processes in financial markets through a system of visual models (waves) on price charts. The author of the theory, Ralph Elliott, identified eight variants of alternating waves (of which five are in the trend and three are against the trend). The mo
Was: $249  Now: $99   Market Profile defines a number of day types that can help the trader to determine market behaviour. A key feature is the Value Area, representing the range of price action where 70% of trading took place. Understanding the Value Area can give traders valuable insight into market direction and establish the higher odds trade. It is an excellent addition to any system you may be using. Inspired by Jim Dalton’s book “Mind Over Markets”, this indicator is designed to suit the
WanaScalper
Isaac Wanasolo
1 (1)
A scalping indicator based on mathematical patterns, which on average gives signals with relatively small SL, and also occasionally helps to catch big moves in the markets (more information in the video) This indicator has three main types of notifications: The first type warns of a possible/upcoming signal on the next bar The second type indicates the presence of a ready signal to enter the market/open a position The third type is for SL and TP levels - you will be notified every time price r
PipFinite Exit EDGE MT5
Karlo Wilson Vendiola
4.89 (37)
Did You Have A Profitable Trade But Suddenly Reversed? In a solid strategy, exiting a trade is equally important as entering. Exit EDGE helps maximize your current trade profit and avoid turning winning trades to losers. Never Miss An Exit Signal Again Monitor all pairs and timeframes in just 1 chart www.mql5.com/en/blogs/post/726558 How To Trade You can close your open trades as soon as you receive a signal Close your Buy orders if you receive an Exit Buy Signal. Close your Sell orde
Smooth price for Monarch
Konstantin Gruzdev
5 (1)
The Smooth Price technical indicator is used for plotting a smoothed line as close to the price of the financial instrument as possible, and serves to eliminate its noise components. The indicator is part of the Monarch trading system, but here it is presented as an independent technical analysis tool. The indicator is based on the cluster digital filter , which, unlike the ClusterSMA , is applied directly to the price time series. Smooth Price does not redraw (except the very last, zero bar) an
The diamond top and bottom are reversal patterns. It represents a rally to a new high with a drop to a support level followed by a rally to make a new high and a quick decline, breaking the support level to make a higher low. The bounce from the higher low is then followed by a rally, but making a lower high instead. Once this behavior is identified, prices then break the trend line connecting the first and second lows and start to decline further. You can find MT4 version hier Indicator show
Il Catturatore di Tendenza: La Strategia del Catturatore di Tendenza con Indicatore di Allarme è uno strumento versatile di analisi tecnica che aiuta i trader a identificare le tendenze di mercato e i potenziali punti di ingresso e uscita. Presenta una Strategia dinamica del Catturatore di Tendenza, adattandosi alle condizioni di mercato per una chiara rappresentazione visiva della direzione della tendenza. I trader possono personalizzare i parametri in base alle loro preferenze e tolleranza
FREE
PipFinite Trend PRO MT5
Karlo Wilson Vendiola
4.87 (666)
Breakthrough Solution For Trend Trading And Filtering With All Important Features Built Inside One Tool! Trend PRO's smart algorithm detects the trend, filters out market noise and gives entry signals with exit levels. The new features with enhanced rules for statistical calculation improved the overall performance of this indicator. Important Information Revealed Maximize the potential of Trend Pro, please visit www.mql5.com/en/blogs/post/713938 The Powerful Expert Advisor Version Automa
Atomic Analyst MT5
Issam Kassas
4.6 (20)
Innanzitutto, vale la pena sottolineare che questo indicatore di trading non è repaint, non è ridisegno e non presenta ritardi, il che lo rende ideale sia per il trading manuale che per quello automatico. Manuale utente: impostazioni, input e strategia. L'Analista Atomico è un indicatore di azione del prezzo PA che utilizza la forza e il momentum del prezzo per trovare un miglior vantaggio sul mercato. Dotato di filtri avanzati che aiutano a rimuovere rumori e segnali falsi, e aumentare il pote
Orbit Rage Final 2
BILLY ARANDUQUE ABCEDE
Note : i only sell this EA on MQL5, any other sellers is fake. Orbit Rage Final, a cutting-edge trading strategy meticulously designed around the bull/bear candle approach and divergence analysis. This powerful tool is engineered to empower you to shape the life you desire. To embark on this transformative journey, simply download and seamlessly integrate it into your MetaTrader 4 platform by placing it in the experts advisors folder. Orbit Rage Final revolutionizes trading by offering a risk-f
**   All Symbols   x   All Time frames   scan just by pressing scanner button ** *** Contact me after the purchase to send you instructions and add you in "Order Block group" for sharing or seeing experiences with other users. Introduction: The central banks and financial institutions mainly drive the market,   Order block is considered a market behavior that indicates accumulation of orders from banks and institutions, then   the market tends to make a sharp move(Imbalance) on either side once
This indicator shows a candle combination based on dodge, dodge and pin bar. The logic of the pattern is to stand on the side of strength, after uncertainty. The indicator is universal and is useful for trading binary options, forex, ETFs, cryptocurrency, stocks. The indicator supports timeframes from M5 to MN, including non-standard TF presented in MT5. (М5,М6,М10,M12, M15, M20, M30, H1, H2, H3, H4, H6, H8, H12, D1, W1, MN). The ability to enable and disable TF is implemented. Sound alerts and
MSnR Lines
Pierre Paul Amoussou
MSnR Lines è un indicatore personalizzato progettato per visualizzare i livelli di supporto e resistenza su un grafico. Questi livelli si basano sulla teoria del supporto e della resistenza malese, che definisce i livelli non come aree, ma come specifici livelli di prezzo derivati dai picchi e dai valli del grafico a linee. Caratteristiche: Tre tipi di livelli: A-Level, V-Level e Gap Level. Indicazione di freschezza per i livelli: i livelli freschi sono più significativi dei livelli non freschi.
PZ Trend Trading MT5
PZ TRADING SLU
3.67 (3)
Capture every opportunity: your go-to indicator for profitable trend trading Special Offer: Purchase now to receive free bonuses worth $159! (Read more for details) Trend Trading is an indicator designed to profit as much as possible from trends taking place in the market, by timing pullbacks and breakouts. It finds trading opportunities by analyzing what the price is doing during established trends. [ Installation Guide | Update Guide | Troubleshooting | FAQ | All Products ] Trade financial
Hi LUNA
Mao Jun Hu
Benvenuti nel programma di trading LUNA! Siamo orgogliosi di presentare LUNA, un EA progettato specificamente per XAUUSD. Sviluppato nel corso di diversi anni da un autore con oltre 15 anni di esperienza nel trading, LUNA rappresenta una svolta tecnologica. ————————————————   —————— Live Signal(mt4): Click here mt4: Click here ————————————————   —————— Caratteristiche: Sistema di trading onesto: LUNA non utilizza reti neurali AI, strategie Martingale o tecniche simili. Non imbroglia per ottene
Order Book, known also as Market Book, market depth, Level 2, - is a dynamically updated table with current volumes of orders to buy and to sell specific financial instument at price levels near Bid and Ask. MetaTrader 5 provides the means for receiving market book from your broker, but in real time only, without access to its history. The indicator OrderBook Cumulative Indicator accumulates market book data online and visualizes them on the chart. In addition, the indicator can show the market
SmartTrendMt5
Andrey Spiridonov
The SmartTrendMt5 trend indicator generates signals based on the principle of combined analysis of calculated reference points within the Keltner channel. The indicator plots the Keltner channel in a separate window (by default, red lines and a blue line - the middle of the channel), and also draws the histogram of calculated reference points for each candle (by default, the histogram bars are yellow). The should be attached to a chart of any timeframe and any trading symbol in the usual way.
Strumenti per il guadagno e la ricerca. Il nucleo dei segnali e della strategia di trading si basa sull'algoritmo dell'autore per la formazione di modelli di previsione dei prezzi. Applicabile a qualsiasi strumento! Integrato con un sistema di controllo basato sull'MA "Volpe a nove code" , aggiornando e regolando il segnale nel modo più accurato possibile per il mercato, lo strumento e il periodo di lavoro. Idoneo: tutti gli strumenti in tutti i mercati (ci sono eccezioni). A chi è rivolto: h
Terra Infinity is a flat indicator. This improved version of the CalcFlat indicator has three additional lines that significantly increase its effectiveness. Unlike its predecessor with two static levels, Terra Infinity adds three dynamic lines above the main histogram, which are interpreted as follows: base signal line, minimum signal line, maximum signal line. These lines are formed using the additional parameter Avg, which is the average value of the histogram. Averaging produces a line
Discover our groundbreaking scalping trading bot designed for small trading accounts. This bot utilizes a simple fractal breakout strategy, executing fast trades based on local highs and lows. Key Features: Trading System: Utilizes fractals for entry points in both long and short positions. Settings Explained: Detailed inputs including timeframes, risk management, and ATR-based stop-loss and take-profit levels. Optimal Trading Times: Best used with pairs like EUR/USD or USD/JPY during liquid ma
The "RMA Signal Indicator MT5" refers to an indicator called "RMA" (Running Moving Average) Signal Indicator designed specifically for the MetaTrader 5 (MT5) trading platform. The RMA is a variation of the Moving Average indicator that emphasizes recent price data. The specific details and functionality of the "RMA Signal Indicator MT5" may depend on the developer or the version you are using. However, in general, here is a general approach to using a signal indicator like RMA on the MT5 platfor
Gli utenti di questo prodotto hanno anche acquistato
Классификатор силы тренда. Показания на истории не меняет. Изменяется классификация только незакрытого бара. По идее подобен полной системе ASCTrend, сигнальный модуль которой, точнее его аппроксимация в несколько "урезанном" виде, есть в свободном доступе, а также в терминале как сигнальный индикатор SilverTrend . Точной копией системы ASCTrend не является. Работает на всех инструментах и всех временных диапазонах. Индикатор использует несколько некоррелируемых между собой алгоритмов для класси
Recommended TimeFrame >= H1. 100% Non Repainted at any moment.  Use it carefully, only with Trend Direction. Trading Usage: 2 Variants: as Range System or as BreakOut System (Both Only With Trend Direction)::: (Always use StopLoss for minimise Risk); [1] as Range System: (Recommended) in UP TREND:  - BUY in Blue Line , then if price goes down by 50 points (on H1) open Second BUY.   Close in any Profit you wish: TrailingStop(45 points) or Close when Price touches upper Gold Line. in DOWN TR
Spike Detector
Tete Adate Adjete
this indicator is a Spike detector indicator, it is specially designed to trade Boom 1000, Boom 500, Crash 1000 and Crash 500 We recommend using it on Deriv Boom and Crash indices only Its setting is intuitive, familiar, easy to use it has notification functions; audible notifications and push notifications. this tool is simple to use, easy to handle This update is based on different strategies for spikes
Limitless MT5
Dmitriy Kashevich
Limitless MT5 is a universal indicator suitable for every beginner and experienced trader. works on all currency pairs, cryptocurrencies, raw stocks Limitless MT5 - already configured and does not require additional configuration And now the main thing Why Limitless MT5? 1 complete lack of redrawing 2 two years of testing by the best specialists in trading 3 the accuracy of correct signals exceeds 80% 4 performed well in trading during news releases Trading rules 1 buy signa
Seconds Charts
Aleksandr Goryachev
Micro  ******************* Секундные графики MT5 ********************** Более точного инструмента для входа в сделку вы не найдёте. Входные параметры: Timeframe, sek - период построения графика, секунды Displayed bars - отображаемые бары Step of price levels, pp, 0-off - шаг отрисовки ценовых уровней, пункты Scale points per bar, 0-off - масштаб в пунктах на бар Show lines - отображение текущих уровней Show comment - отображение комментария Standard color scheme - стандартная цветовая сх
Trend and Signals MT5  indicator scans  30 trading Instruments (Forex, Metals and Indices).     It uses special algorithm on the  current market   based on   Pure Price Action   and display the overall trend and signal on the dashboard. When signals are produced the indicator sends alert and notification. Strategy for Signals This indicator uses the daily timeframe to determine the direction of the trend. The hourly timeframe is used to identify possible entries. Main trend and is determined by
Cycles Forecast
Pooriya Alirezaee
This indicator is based on a mathematical formula and an ANN combined, designed to make a model(using previous prices) of the most recent market condition (any chart*) in order to use the model as a forecasting tool. *This indicator can operate on any chart/timeframe, but it's suggested you use multiple timeframes for each trade because this method relies solely on the time factor, you can not use this indicator to predict price volatility, but if it's fit correctly it will show you when the nex
BC Scalper Aroow
Tete Adate Adjete
This indicator is based on the crossing of two Moving Average with the RSI It is intended for scalpers Specially designed for Boom and Crash syhtetic indices from Binary.com/Deriv.com It is easy to use and intuitive. We recommend its use on M1 and is equipped with three types of notification Email alert Sound notification Push notification these parameters can be activated and deactivated.
This indicator is a scalping indicator intended solely for the Boom and Crash indices of the Deriv Limited market It supports Boom 500, Boom 1000, Crash 500 and Crash 1000 Not repaint and no bug The settings are intuitive and easy to use The product activation number is 20 The Time Frame used depends on the user If you are an aggressive scalper then just use M1 For long trades use M15 If you are conservative use M5 Please contact me for more details of its use
ForexAndCryptoTradeTool
Gabriel Ferreira Da Silva
Quantitative analysis software, this indicator came from another country and thanks to my network today I can share this software with you! Russian Tool plots arrows on your asset, indicating the trend the asset will enter, easy to use and easy to install indicator We have been working with robots and indicators since 2018! We came to MQL5 to be able to bring better benefits at the time of payment by our customers!, our Instagram where we post daily stories of operations: https://www.inst
Dodici reti neurali artificiali divise in quattro insiemi cercando di prevedere la direzione del movimento dei prezzi in futuro: piccolo: 1 minuto, medio: 5 minuti, grande: 30 minuti, reale: 15 minuti. Questo indicatore per il trading attivo ad alta frequenza è pronto per funzionare un EA lanciato separatamente e che riceve segnali dall'indicatore sotto forma di variabili globali pubblicate dall'indicatore. Questo indicatore non funziona nel tester di strategia, quindi guarda il video o, scrivi
Recuroid
Andriy Sydoruk
The Recuroid indicator shows very good entry points. Just look at the screenshots, then download the free version and look in the strategy tester and see for yourself. The system is based on two key algorithms. The first algorithm (managed) creates a system of balanced transition from the buy zone to the sell zone and vice versa, draws arrows and lines, and forms entries. The second algorithm (managing) corrects the initial data for the first algorithm (managed) by measuring virtual windows,
Balance Weighted Moving Hedge System- is the trend following manual system for forex/crypto market. Indicator represents custom balance-weighted moving average indicator. The main advantagies : very stable moving with really early signals, defines current trend power, ignores market noise. The more width of indicator line - the more expressive trend is. On the other hand thin moving line shows unstable / choppy market. Indicator can be used as single b alance weighted moving or with hedge strate
Live broadcast of the indicator on YouTube. Please click on the link below for more credibility. There are also videos of the indicator that you can watch. Note that the broadcast is late, do not rely on it. Only a review of the indicator is only a review of the indicator’s accuracy, which does not lose almost and the profit rate reaches 95%. I will work with great accuracy on the CRASH coin 1000 INDICES
MMM Gold Sniper MT5
Gilang Wardhana Purnama Putra
Indicator is based on   Market Maker Strategy.   NO REPAINT. MM's are traders and their objective is to make money.  This includes strategies to trade against retails traders.  The major difference between them and other traders is that they have the ability, through access to massive volumes, to move price at their will.  So to make money, they aim to buy at a lower price and then sell at a higher price. They achieve this by:  1. Inducing traders to take positions. This is achieved by using a
Entry Pro
Bartlomiej Tadeusz Tomaja
Entry Pro Indicator is a powerful multi-functional trading tool designed to increase your market entry accuracy. It combines the power of several key market trend indicators, including ATR Trailing Stop and both fast and slow EMA, to provide comprehensive market insight. It offers easy-to-interpret market entry signals represented by colored arrows. Also, it's fully customizable, allowing you to adjust ATR and EMA periods to suit your trading strategy. Trend filters and alerts can be toggled on
Make Sure to Read the Description! UT Bot Plus contains free EA! The EA can be downloaded from telegram channel:  https://t.me/ +NSOJTvH39fNhZmU0 Unlock the Power of Automated Trading with UT BOT Indicator, Integrated with a FREE EA! ( Limited time offer ) This version has been expanded to include multiple additional filtering options. These options are fully configurable and can be switched on and off. This versatile UT BOT indicator is crafted and optimized to work seamlessly with the
Hello I Want to introduce The Forex Buy Sell Arrow Premium MT5 i recently release this premium indicator! its 1000% Non Repaint Indicator, It Work Perfectly Well,, i tested it day by day, Just mind blowing Result,  Including Powerful trend Algorithm! How It Work? well, it work market trend formula, when trend Bullish Or when trend Bearish,  Recommend Timeframe M30, H1 it work all timeframe, and all currency pair, 100% non repaint, How to take signal From Forex Buy Sell Arr
Tatino Super Signals is Non Repaint Indicator for Binary Option trading and Forex trading. Recommendations: Timeframe: All timeframes. For best results we recommend using it on M1, M5 and M15 timeframes. Currency pairs: All Pairs Account type: All Type Broker time: Any Brokers : Alls Binary Trading : Expired 1 Candle Buffer Buy=1, Sell=0, Entry Next Candle Recommended Forex trading stop loss : 15 pips Recommended  Forex tradingTake profit levels : 15 pips Specifications: Does not repaint  
Magicx
Hasan Abdulhussein
The indicator places a buy or sell signal when the conditions of the strategy it was designed with are met. The strategy is guaranteed, strong, and has been tested for 9 years. The indicator is for binary options and can be converted into a bot by linking it to MT2Trading, where it sends the signal to this platform. This platform automatically opens a trade on the trading platform you are using, whether it is Pocket Option, IQ Option, or any other binary options platforms. The entry is on the n
Atbot
Zaha Feiz
4.97 (29)
AtBot:  Come funziona e come usarlo ### Come funziona L'indicatore "AtBot" per la piattaforma MT5 genera segnali di acquisto e vendita utilizzando una combinazione di strumenti di analisi tecnica. Integra la Media Mobile Semplice (SMA), la Media Mobile Esponenziale (EMA) e l'indice di Gamma Vero Medio (ATR) per identificare opportunità di trading. Inoltre, può utilizzare le candele Heikin Ashi per migliorare la precisione dei segnali. Lascia una recensione dopo l'acquisto e ricevi un regalo bon
Innanzitutto è importante sottolineare che questo sistema di trading è un indicatore Non-Repainting, Non-Redrawing e Non-Lagging, il che lo rende ideale sia per il trading manuale che per quello automatico. Corso online, manuale e download di preset. Il "Sistema di Trading Smart Trend MT5" è una soluzione completa pensata sia per i trader principianti che per quelli esperti. Combina oltre 10 indicatori premium e offre più di 7 robuste strategie di trading, rendendolo una scelta versatile per div
TPSpro RFI Levels MT5
Roman Podpora
4.67 (9)
Inverti il primo livello di impulso (RFI)       istruire       Russia       -        ESP   Raccomandazione di utilizzare   l'indicatore -   TPSpro   Trend Edizione Professional -Versione   MT5 La cosa più importante nel comercio son è la cosa più importante in futuro. La cosa più importante è la cosa più importante. Funzioni principali: La maggior parte delle zone sono attivate da venditori e compradores! Indicador mostra tutti i livelli/zone dei primi impulsi corretti per acquisti e vendite. LO
TPSproTREND PrO MT5
Roman Podpora
4.89 (9)
TPSpro TREND PRO   è un indicatore di tendenza che analizza automaticamente il mercato, fornisce informazioni sulla tendenza e sui rispettivi cambiamenti e fornisce segnali per entrare nelle operazioni senza ridisegnare. L'indicatore utilizza ciascuna candela e la analizza separatamente. Si riferisce a vari shock al rialzo o al ribasso. Punto di ingresso preciso per il trading di valute, criptovalute, metalli, azioni e indici! Versione MT5                   Descrizione completa dell'indicatore
Gold Stuff mt5
Vasiliy Strukov
4.9 (185)
Gold Stuff mt5 è un indicatore di tendenza progettato specificamente per l'oro e può essere utilizzato anche su qualsiasi strumento finanziario. L'indicatore non ridisegna e non è in ritardo. Periodo consigliato H1. Contattami subito dopo l'acquisto per avere le impostazioni e un bonus personale!   I risultati in tempo reale possono essere visualizzati qui.  Puoi ottenere una copia gratuita del nostro indicatore Strong Support e Trend Scanner, per favore scrivi in ​​privato. M   IMPOSTAZION
Quantum Trend Sniper
Bogdan Ion Puscasu
4.92 (48)
Presentazione       Quantum Trend Sniper Indicator   , l'innovativo indicatore MQL5 che sta trasformando il modo in cui identifichi e scambi le inversioni di tendenza! Sviluppato da un team di trader esperti con un'esperienza di trading di oltre 13 anni,       Indicatore Quantum Trend Sniper       è progettato per spingere il tuo viaggio di trading verso nuove vette con il suo modo innovativo di identificare le inversioni di tendenza con una precisione estremamente elevata. *** Acquista Quant
Top indicator for MT5   providing accurate signals to enter a trade without repainting! It can be applied to any financial assets:   forex, cryptocurrencies, metals, stocks, indices .  Watch  the video  (6:22) with an example of processing only one signal that paid off the indicator! MT4 version is here It will provide pretty accurate trading signals and tell you when it's best to open a trade and close it. Most traders improve their trading results during the first trading week with the help of
Trend Screener Pro MT5
STE S.S.COMPANY
4.88 (67)
Indicatore di tendenza, soluzione unica rivoluzionaria per il trading di tendenze e il filtraggio con tutte le importanti funzionalità di tendenza integrate in un unico strumento! È un indicatore multi-timeframe e multi-valuta al 100% non ridipingibile che può essere utilizzato su tutti i simboli/strumenti: forex, materie prime, criptovalute, indici e azioni. Trend Screener è un indicatore di tendenza che segue un indicatore efficiente che fornisce segnali di tendenza a freccia con punti nel gra
FX Power MT5 NG
Daniel Stein
5 (6)
Ricevi il tuo aggiornamento quotidiano sul mercato con dettagli e schermate tramite il nostro Morning Briefing qui su mql5 e su Telegram ! FX Power MT5 NG è la nuova generazione del nostro popolare misuratore di forza delle valute, FX Power. Cosa offre questo misuratore di forza di nuova generazione? Tutto ciò che avete amato dell'FX Power originale IN PIÙ Analisi della forza di ORO/XAU Risultati di calcolo ancora più precisi Periodi di analisi configurabili individualmente Limite di calcolo pe
Innanzitutto, vale la pena sottolineare che questo Strumento di Trading è un Indicatore Non-Ridipingente, Non-Ridisegnante e Non-Laggante, il che lo rende ideale per il trading professionale. Corso online, manuale utente e demo. L'Indicatore Smart Price Action Concepts è uno strumento molto potente sia per i nuovi che per i trader esperti. Racchiude più di 20 utili indicatori in uno solo, combinando idee di trading avanzate come l'Analisi del Trader del Circolo Interno e le Strategie di Trad
Altri dall’autore
ScalpAuT
Vadym Zhukovskyi
5 (5)
ScalpAuT - a scalping timing bot. Today we want to introduce the indispensable ScalpAuT assistant. This is an Expert Advisor that works on any financial pair according to the timings (time levels) of the VIST system. It took us a long time to decide whether to release an expert or not. Many people are looking for the Grail. They only dream of doing nothing, but earning millions of money. Dreaming is always good. But our advisor is definitely not for such people. Our Expert Advisor is designed fo
Filtro:
TheKnowledgeSeeker
46
TheKnowledgeSeeker 2024.06.19 16:35 
 

Thanks to the VIST Trading System, I now have a significant edge that many other traders might not possess. While I aim to become proficient in manual trading, as a developing trader, I often find myself constrained by time. VIST helps me stay on track and not fall behind in my progress. The system offers a wide array of indicators that greatly enhance my understanding of price movements, trends across different time frames, and reactions at various price points. It also provides valuable insights into price volume. Overall, VIST has dramatically sharpened my trading skills, making it an indispensable tool, especially for beginners like myself who are looking to gain a competitive advantage in the market.

Vadym Zhukovskyi
1178
Risposta dello sviluppatore Vadym Zhukovskyi 2024.06.19 17:13
Thank you for your constructive and detailed feedback. Those who strive for learning and development are always the way to success. The iVISTscalp5 forecast indicator is really designed for traders of any level. It looks like a scientific laboratory where everyone will find great benefits for work and learning. Good luck to you and the best!
evans.ocansey.doe
19
evans.ocansey.doe 2024.06.11 15:33 
 

This indicator is highly accurate, and the support I receive from the creator is outstanding. The developers don't just leave you after purchasing the indicator; they are also willing to guide you on how to use it to achieve consistent profits. I have been extremely impressed with the consistent success I've experienced so far. Therefore, I highly recommend this indicator to everyone, whether you are just starting to trade or are a professional trader. The combination of accuracy and dedicated support makes it an invaluable tool in any trader's arsenal.

Vadym Zhukovskyi
1178
Risposta dello sviluppatore Vadym Zhukovskyi 2024.06.11 15:50
Thank you for such a detailed review. Thank you for your positive words and wish you success and profit! We will always try to do everything so that people can comfortably use our forecasting tools.
Marco Fiaes
92
Marco Fiaes 2024.04.10 04:28 
 

je donne mon avis sur ce produit, je vous le recommande fortement je trouve mieux qu'un robot. merci encore pour ce produit.

Vadym Zhukovskyi
1178
Risposta dello sviluppatore Vadym Zhukovskyi 2024.04.10 14:57
Merci pour votre attention. Je vous souhaite du succès et le meilleur!
Ravindra Bhosale
23
Ravindra Bhosale 2024.02.08 02:56 
 

Hello, I have been using this indicator since a month. First I used it on demo account and found it more informative and result oriented. Just you have to follow it's basic rules and discipline then see it's magic. Study, practice and discipline is the key of success. It's more useful for novice trader .Thanks . All the Best.

Vadym Zhukovskyi
1178
Risposta dello sviluppatore Vadym Zhukovskyi 2024.02.08 03:00
Thank you for your feedback! I wish you profit and the best!
Ari Mustafa
45
Ari Mustafa 2023.07.21 07:14 
 

Guys, trust me this indicator is not like others, the best indicator I’ve ever seen, a great support and help always 24/7, thank you guys for making this great tool and your kind support.

Vadym Zhukovskyi
1178
Risposta dello sviluppatore Vadym Zhukovskyi 2023.07.21 07:18
Mustafa, thank you for such words of approval. Good luck and all the best!
Rispondi alla recensione
Versione 10.0 2024.06.08
What's new in the iVISTscalp5 indicator?

1) The iVISTscalp5 indicator has been completely rewritten into another programming language, which has further accelerated data loading and processing.
2) The settings of the iVISTscalp5 indicator have been optimized. We recommend using the iVISTScalp5 indicator by default for any financial instrument. (In the first and last week of the month, you only need to change the first parameter (history_weeks) to the number 8). The recommendation in parentheses is more about novice traders.
3) In the new version of the iVISTscalp5 indicator, two types of forecasts are presented on one chart. The first one is for fast scalping (7 minutes/ 5 weeks), as it was in the previous version of the indicator. The second type (new) is the rays on the chart, which show the forecast of the price movement trend (60 minutes/5 weeks). The rays (forecasts) move behind the price on the chart until their time of action is suitable. The beam length is the average forecast for the profit of a financial instrument.
4) Forecasts in the settings of the iVISTscalp5 indicator can be swapped. In the parameters where the rays are, set 7 minutes, and in the parameters where the flags are, set 60 minutes (or forecasts with other time intervals).
5) All forecasts in the iVISTscalp5 indicator can be obtained in text form for the week ahead. The new version adds dates to the days of the week.
6) All forecast spectra are displayed on the screen. Previously, you had to hover over the flag to see the forecast spectrum. Only one forecast (timing) from the spectrum with the average predicted profit was displayed on the screen.
Versione 9.0 2024.01.06
We accelerated the loading of the quotation history to calculate the forecast of timings.
Versione 8.0 2023.09.16
Improved signatures of lines and channels of the indicator.
Versione 7.0 2023.06.22
Added the average value between the balance of the day and the balance of the week to the chart in the form of an icon.
Versione 6.0 2023.05.10
Added push notifications of timings.
Versione 5.0 2023.04.27
Aggiunto un avviso che indica che è necessario caricare le citazioni. L'indicatore iVISTscalp5 per calcoli complessi ha bisogno di una cronologia delle quotazioni. A volte, quando si installa l'indicatore, tutte le 5 settimane di quotazioni sullo strumento finanziario non vengono caricate. È necessario passare a tempi diversi o caricare manualmente le citazioni. Per 15-30 secondi, l'indicatore calcolerà tutti i tempi e visualizzerà i canali giornalieri e settimanali.
Versione 4.0 2023.02.25
Added levels and channels for easy entry into timings, which allows you to secure trading.
Versione 3.0 2021.08.09
Information is entered for each timing (trading signal) separately about the average price movement of any instrument. The Buy and Sell flags are now represented by two groups. Red and blue flags are the movement above the average for a given time. Pink and blue are the movement of the instrument below the average. By hovering over the flags with the mouse, you can find out how many pips of profit can be obtained when scalping a trading instrument for this timing (trading signal). The alarm clock that is present in the indicator will warn you in advance about all the information on the trading signal.
Versione 2.0 2021.08.04
Improved information panel for some trading instruments